
Figure 1.
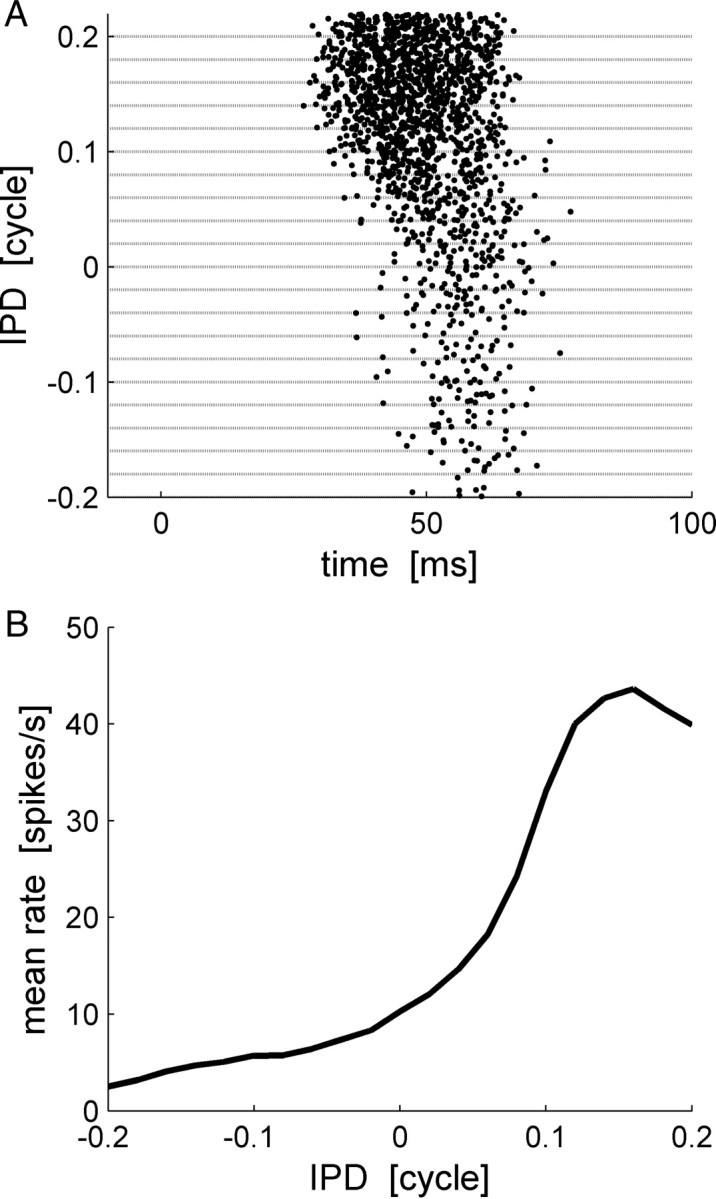
Raster and tuning curve example. A, The raster plot of an IC neuron. The abscissa is time relative to stimulus onset (at time 0). In each row, the spike times of the cell in a single trial are plotted as a dot. The trials are arranged along the ordinate according to the IPD of the stimulus. For every IPD −0.2, −0.18, · · ·, 0.2 cycles, 50 trials are shown. B, The tuning curve. The mean firing rate of the cell is plotted as a function of the IPD. The tuning curves of IC cells can be typically characterized by a bell shape curve and peaks at the cell's preferred IPD, which is denote by θ0 throughout the paper.