
Figure 10.
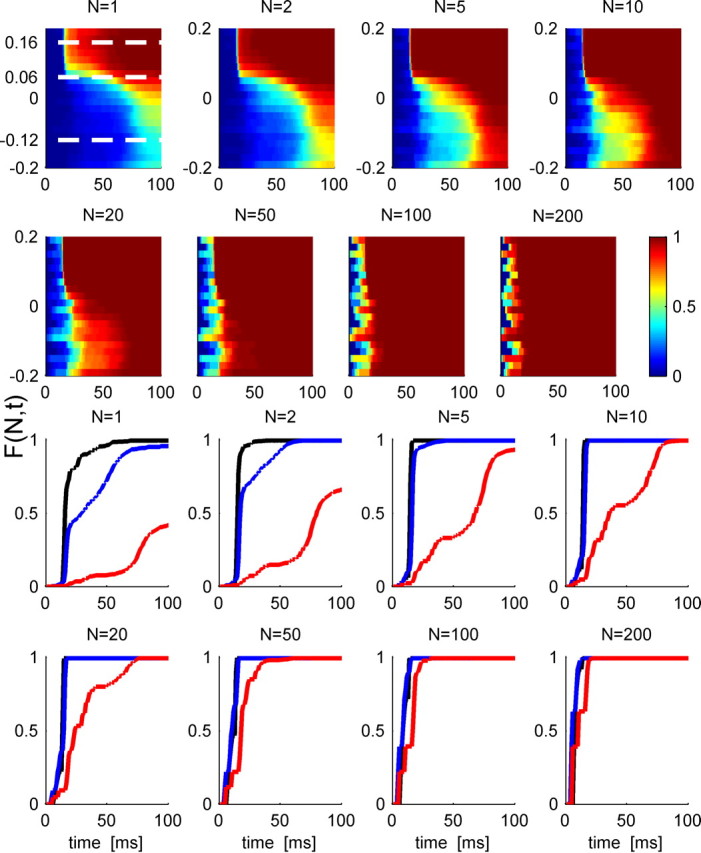
First spike time distribution in a population. Top, The cumulative distribution of first spike time in a pseudopopulation of N cells is shown in a color scale as a function of time from stimulus onset (abscissa) and stimulus IPD (ordinate) for different values of N. Response statistics of the N cells in the pseudopopulation was taken to be independent and identically distributed following response statistics of the cell in Figure 9. The dashed white lines in the N = 1 panel show the preferred IPD, θ0 = 0.16, and θ1 = 0.06, −0.12, used in Figure 9. Bottom rows, The cumulative distribution of first spike times, F(N, t | θ), as a function of time in a homogeneous pseudopopulation of N cells for different population sizes at the preferred IPD, θ0 = 0.16 (black), at an IPD of θ1 = 0.06 (blue), and at an IPD of θ1 = −0.12 (red).