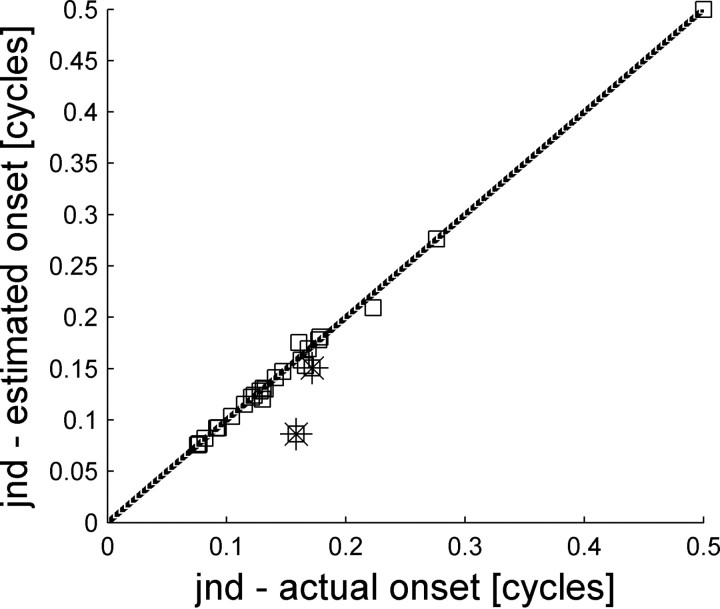
Figure 16.
Comparison of tWTA accuracies with and without onset detection. The tWTA accuracy, in terms of the JND, from the responses of single cells was computed in two ways, one using the stimulus onset time, i.e., fixed onset (abscissa), and one using onset time as estimated by the responses of cell VIII (Figs. 14, 15) (ordinate). Each square shows the JNDs of a single cell in the population. The dashed line shows the identity line. Points below the identity line are cases where estimating stimulus onset time from the neural responses improved the tWTA accuracy. The JND was defined, as above, as the IPD for which the neurometric curve fit crossed the threshold value, Pth = 0.75. Cases where the neurometric curve did not cross threshold are represented by JND value of 0.5 cycles. The two stars mark the two points with the largest deviation from the identity line.

