
Figure 3.
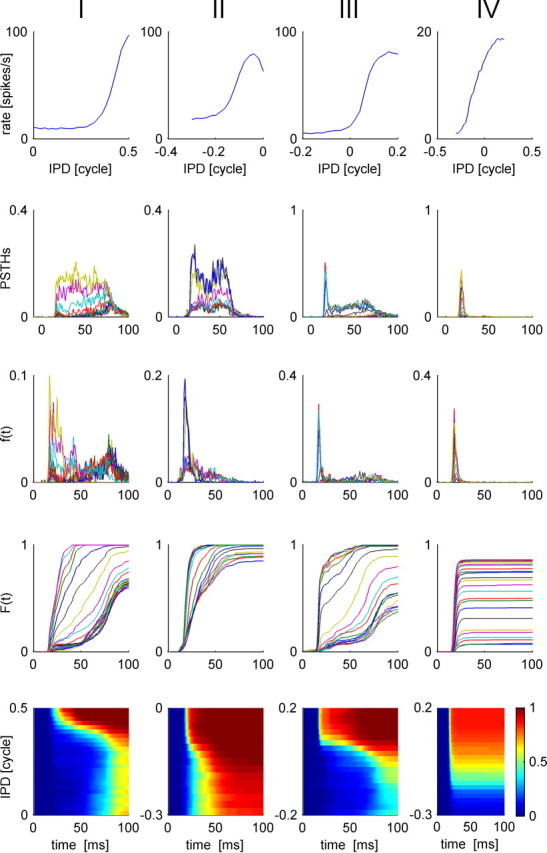
Response statistics of four typical IC cells: I–IV (shown in each column from left to right, respectively). Top, We present the conventional rate-tuning curve of each cell, which is characterized by a single peak at the preferred IPD of each cell. The rate was computed by averaging the number of spike fired by the cell during the 100 ms after stimulus onset. Second row, Tuning of the temporal structure of the response to the IPD. PSTHs of each of the four cells are plotted for the different IPDs in different colors. Third row, First spike time probability density, f(t, θ), is plotted as a function of time from stimulus onset, t, for different values of the IPD, θ, in different colors. Fourth row, First spike time cumulative probability distribution, F(t, θ), is plotted as a function of time from stimulus onset, t, for different values of the IPD, θ, in different colors. Bottom row, First spike time cumulative probability distribution, F(t, θ), is shown in a color plot as a function of time and IPD. The best frequencies of cells I–IV are 282, 242, 349, and 1132 Hz, respectively.