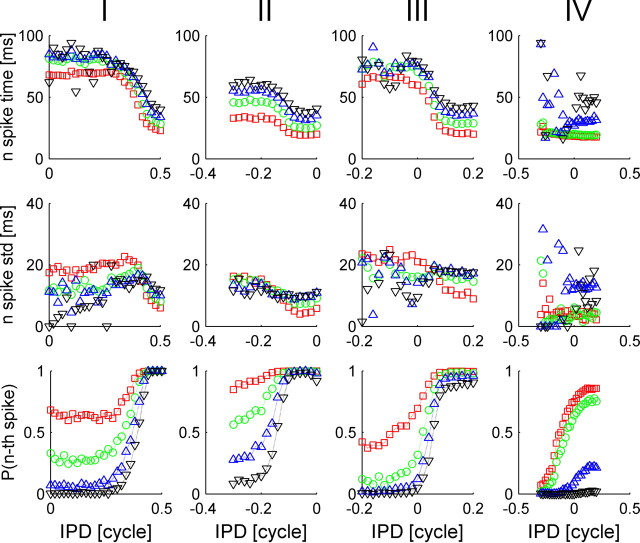
Figure 5.
The nth spike time statistics of four typical IC cells, I–IV (shown in each column from left to right, respectively). Top, We present the mean nth spike time as a function of stimulus IPD (n = 1 in red squares; n = 2 in green circles; n = 3 in blue triangles; n = 4 in black triangles). Middle, We present the standard deviation of the nth spike time as a function of stimulus IPD (n = 1 in red squares; n = 2 in green circles; n = 3 in blue triangles; n = 4 in black triangles). Bottom, Probability of firing the nth spike (during 100 ms after stimulus onset) as a function of stimulus IPD (n = 1 in red squares; n = 2 in green circles; n = 3 in blue triangles; n = 4 in black triangles).

