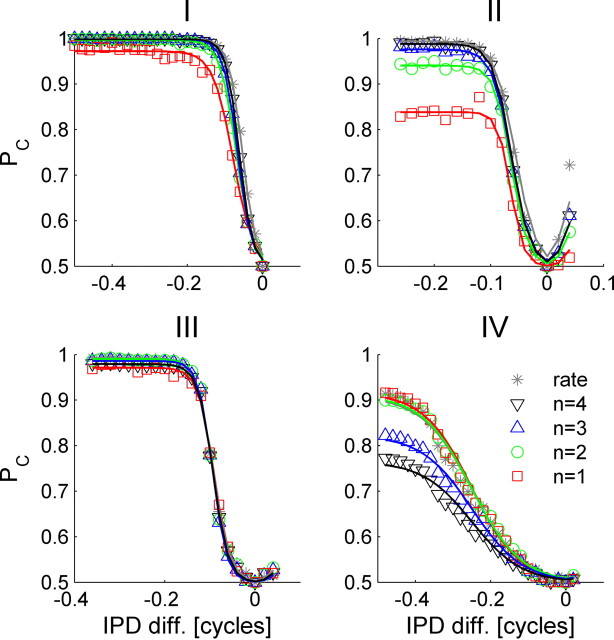
Figure 6.
Quantification of tWTA accuracy. The neurometric curves depicting the probability of correct two-alternative forced-choice discrimination between the neuron best IPD and another IPD as a function of the IPD difference for cells I–IV are shown. The conventional rate code neurometric curves are depicted as gray stars. The neurometric curves for the n-tWTA are in presented by open red squares, green circles, blue upright triangles, and black upside-down triangles for n = 1, 2, 3, and 4, respectively. The solid lines are the logistic function fits to the neurometric curves that were used to compute the JND (see Materials and Methods); hence, the solid lines, in contrast with the open symbols, do not need to obtain the value 0.5 at an IPD difference of zero. Note that the n-tWTA with n = 1 is the tWTA.

