
Figure 8.
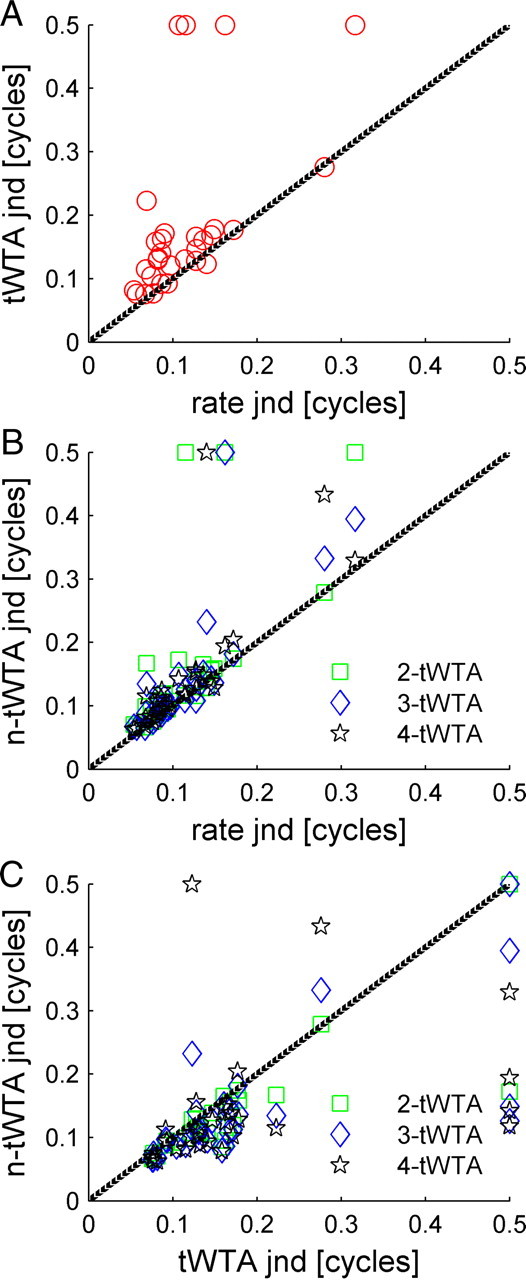
Comparison of n-tWTA and rate code accuracies. A, The JND of the tWTA is plotted as a function of the JND of the conventional rate code readout (i.e., with n = 1). The JND was defined as the IPD for which the neurometric curve fit crossed the threshold value, Pth = 0.75. Cases where the neurometric curve did not cross threshold are represented by JND value of 0.5 cycles. Four of the cells in our data set did not reach threshold. These cells are described in Figure 14. B, The n-tWTA JND is plotted (in green, blue, and black for n = 2, 3, and 4, respectively) as a function of the JND of the conventional rate code readout, which uses the total spike count in the entire response (i.e., the number of spikes fired during 100 ms after stimulus onset). C, The n-tWTA JND is plotted (in green, blue, and black for n = 2, 3, and 4, respectively) as a function of the tWTA (n = 1) JND.