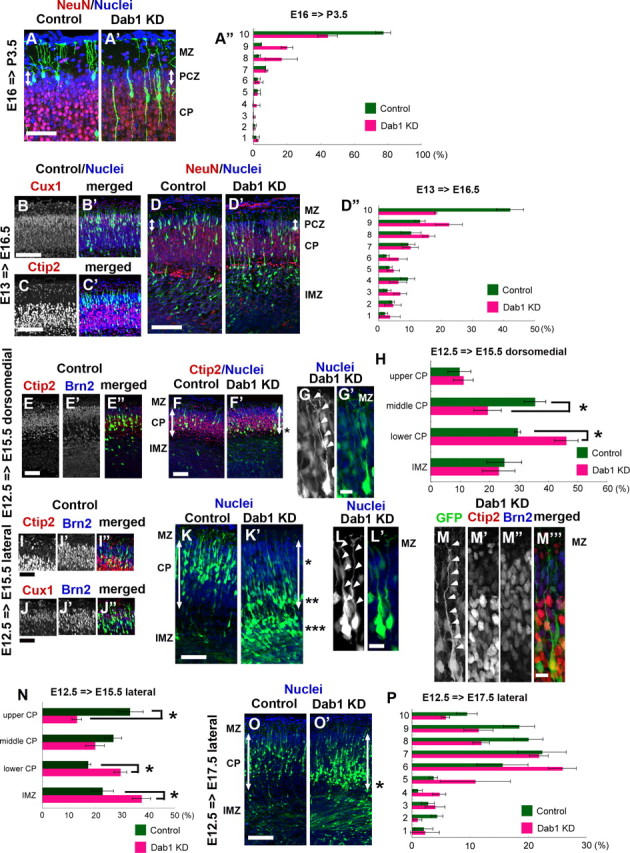
Figure 4.

Dab1 is required for neuronal entry to the outermost region of the CP during all developmental stages. A–A″, Control or Dab1–KD vector was introduced at E16 and the brains were examined at P3.5. Control neurons were positioned within the NeuN-negative PCZ (A, arrow), whereas the Dab1–KD neurons could not enter this zone (A′, arrow). A″, Bin analysis. The thickness of the CP was divided into 10 bins (n = 3 brains each, >120 neurons were counted.) Scale bar, 50 μm. B–B′, C–C′, D–D″, Control or Dab1–KD vector was introduced at E13 and the brains were examined at E16.5. Many control neurons were positioned in the NeuN-negative PCZ (D, arrow), and these neurons were positive for Cux1 (B–B′) but negative for Ctip2 (C–C′). The Dab1–KD neurons, conversely, could not enter the PCZ (D′, arrow). D″, Bin analysis. The distance between the outer margin of the CP and the inner margin of the IMZ was divided into 10 bins. Note that the abnormal accumulation of the Dab1–KD neurons in the ninth bin, but the distribution pattern in the deeper parts of the cortex was similar to that in the control (n = 4 brains each, >400 neurons were counted.) Scale bars, 100 μm. E–E″, F–F′, G–G′, H, Control or Dab1–KD vector was introduced into the dorsomedial cortex at E12.5 and the brains were examined at E15.5. Control neurons were positive for Ctip2 but negative for Brn2 (E–E″), and they were positioned in the middle one-third of the CP (F). Many Dab1–KD neurons, conversely, were located at the border between the CP and the IMZ (F′, *). Arrows indicate the thickness of the CP. G–G′, Higher-magnification view of the Dab1–KD neurons located at the border between the CP and the IMZ. Note that their leading processes are attached to the MZ (arrowheads). H, Bin analysis. The cortex was divided into upper CP, middle CP, lower CP, and IMZ. Note that Dab1–KD neurons were abnormally accumulated in the lower CP (*p = 0.0495, Mann–Whitney's test, n = 3 brains each, >200 neurons were counted.) Scale bars: E-E″, F–F′, 50 μm; G–G′, 10 μm. I–I″, J–J″, K–K′, L–L′, M–M‴, N, Control or Dab1–KD vector was introduced into the lateral cortex at E12.5 and the brains were examined at E15.5. Control neurons were positioned in the outermost region of the CP (K), and many of them were double-positive for Ctip2 and Brn2 (I–I″) or Cux1 and Brn2 (J–J″). Dab1–KD neurons, conversely, were accumulated in three different areas (*, **, ***) (K′). * denotes the neuronal accumulation around the border between the upper one-third of the CP and the middle one-third of the CP. ** denotes the neuronal accumulation around the border between the CP and the IMZ. *** denotes the neuronal accumulation below the CP. Arrows indicate the thickness of the CP. L–L′, Higher-magnification view of Dab1–KD neurons located at the border between the upper CP and the middle CP (representative images at *). Note that their leading processes reach the MZ (arrowheads). M–M‴, Higher-magnification view of Dab1–KD neurons located at the border between the CP and the IMZ (representative images at **). Note that their leading processes also reach the MZ (arrowheads). Red represents Ctip2-positive cells, and blue represents Brn2-positive cells. N, Bin analysis. The cortex was divided into the upper CP, middle CP, lower CP, and IMZ (*p = 0.0209, Mann–Whitney's test; n = 4 brains each, >700 neurons were counted.) Scale bars: I–I″, J–J″, K–K′, 50 μm; L–L′, M–M‴, 10 μm. O–O′, P, The control or Dab1–KD vector was introduced into the lateral cortex at E12.5 and the brains were examined at E17.5. O, Control case. O′, Most of the Dab1–KD neurons were located in the CP, but they were settled in a slightly deeper place than the control neurons. Note the positioning of some Dab1–KD neurons at the border between the CP and the IMZ (*). Arrows indicate the thickness of the CP. P, Bin analysis. The distance between the outer margin of the CP and the inner margin of the IMZ was divided into 10 bins (n = 3 brains each, >400 neurons were counted.). Scale bar, 100 μm.
