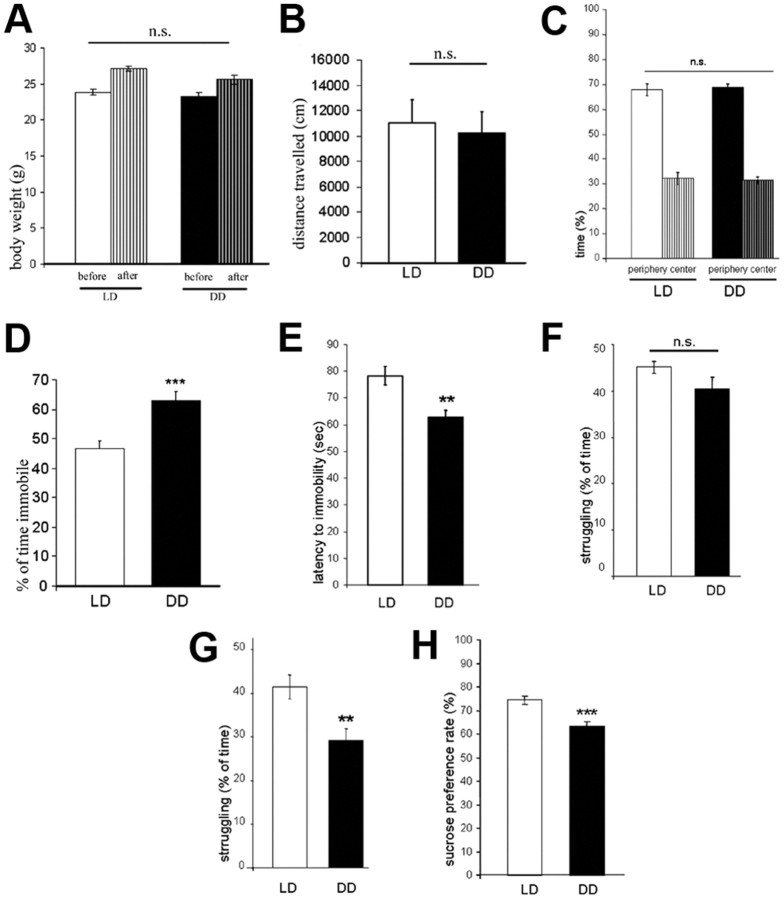
Figure 1.
A, Body weight before the beginning and at the end of the experimental period. B, Locomotor activity in the open field measured as total distance traveled (in centimeters). C, Time spent in the center and the periphery of the open field. D, Immobility (percentage of total time) in the forced-swim test. E, Latency to immobility (in seconds) in the forced-swim test. F, Percentage of time spent struggling during the first 2 min of the forced-swim test. G, Percentage of time spent struggling during the last 4 min of the forced-swim test. H, Sucrose preference rate (percentage). All data are displayed as mean ± SEM. **p < 0.01, ***p < 0.001; n.s. (not significant), p > 0.05.

