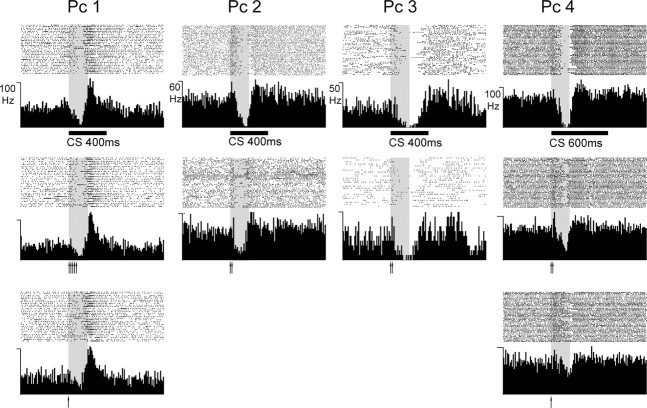
Figure 2.
Conditioned Purkinje cell responses. CRs from four different Purkinje cells (Pc 1–Pc 4) displayed as raster plots and PSTHs. The CS consisted of 50 Hz trains of single pulses to the mossy fibers. Upper row shows the average response to CS-alone stimulation after conditioning with a 200 ms CS–US interval (gray shading) using different CS durations (bar below graph). Each graph is based on 40 trials. The duration is 1.5 s. The second and third rows show CRs elicited with short CSs. Each CS pulse is indicated by an arrow (interval between stimuli was 20 ms).

