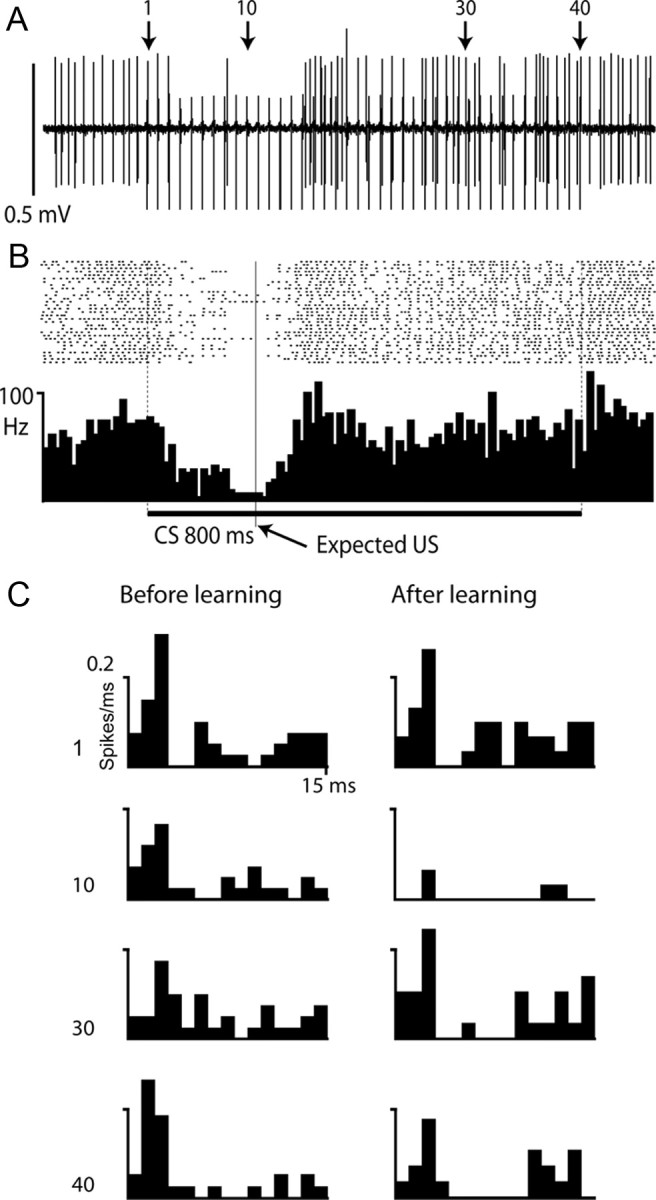
Figure 3.

Purkinje cell response to 800 ms train of mossy fiber stimuli. A, B, Sample record (A) and raster plot and PSTH (B) showing simple spike firing in Purkinje cell on CS-alone trials. The cell was trained with a 200 ms ISI and 800 ms CS consisting of a 50 Hz train of stimuli to the mossy fibers. Shock artifacts can be seen in A as 40 vertical lines extending below the simple spikes. C, Poststimulus time histograms of responses over 40 trials to the mossy fiber stimuli 1, 10, 30, and 40, indicated by arrows in A, before (left) and after (right) training. Each bin is 1 ms and the y-axis indicates probability of firing.
