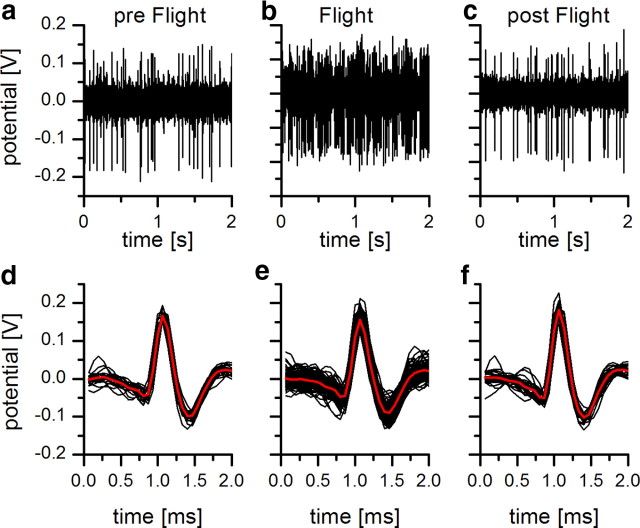
Figure 3.
Raw voltage traces of H1 recording. a–c, Voltage traces before (a), during (b), and after (c) flight. The quality of the recording did not change during an experiment. d–f, This can also be seen in the spike wavelets before (d), during (e), and after (f) flight. The red lines represent the mean waveforms of the detected spikes.

