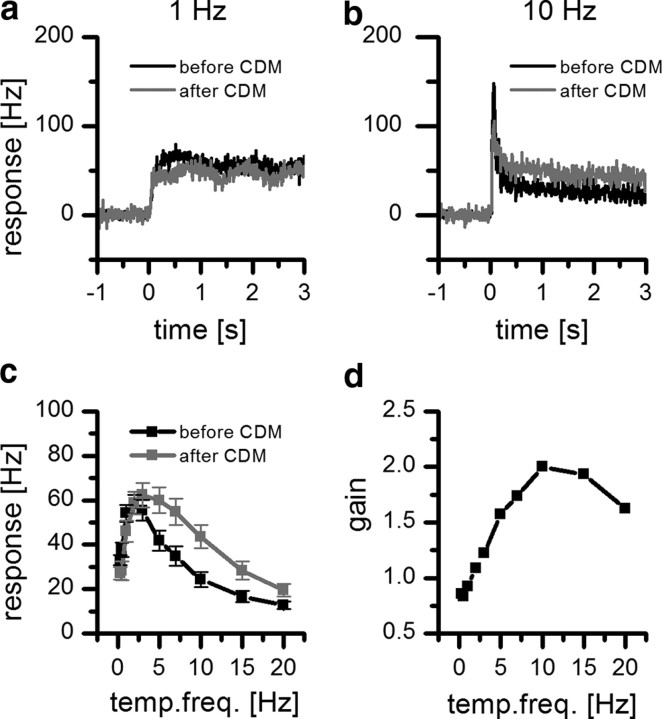
Figure 5.
Effect of CDM on the velocity tuning of H1. a, Peristimulus time histogram of the mean response of H1 to a 1 Hz stimulation lasting for 3 s before (black line) and after (gray line) application of CDM (n = 10, 10 trails for each fly; bin width = 10 ms). b, Same as a but for a 10 Hz stimulus. c, Temporal frequency (temp. freq.) curve of the mean response of H1 before and after application of the octopamine agonist CDM (n = 10, 10 trails for each fly). Plotted is the mean response ± SEM. d, Mean response gain as a function of temporal frequency. The gain is defined as the ratio of the mean response after and before the application of CDM.

