
Figure 6.
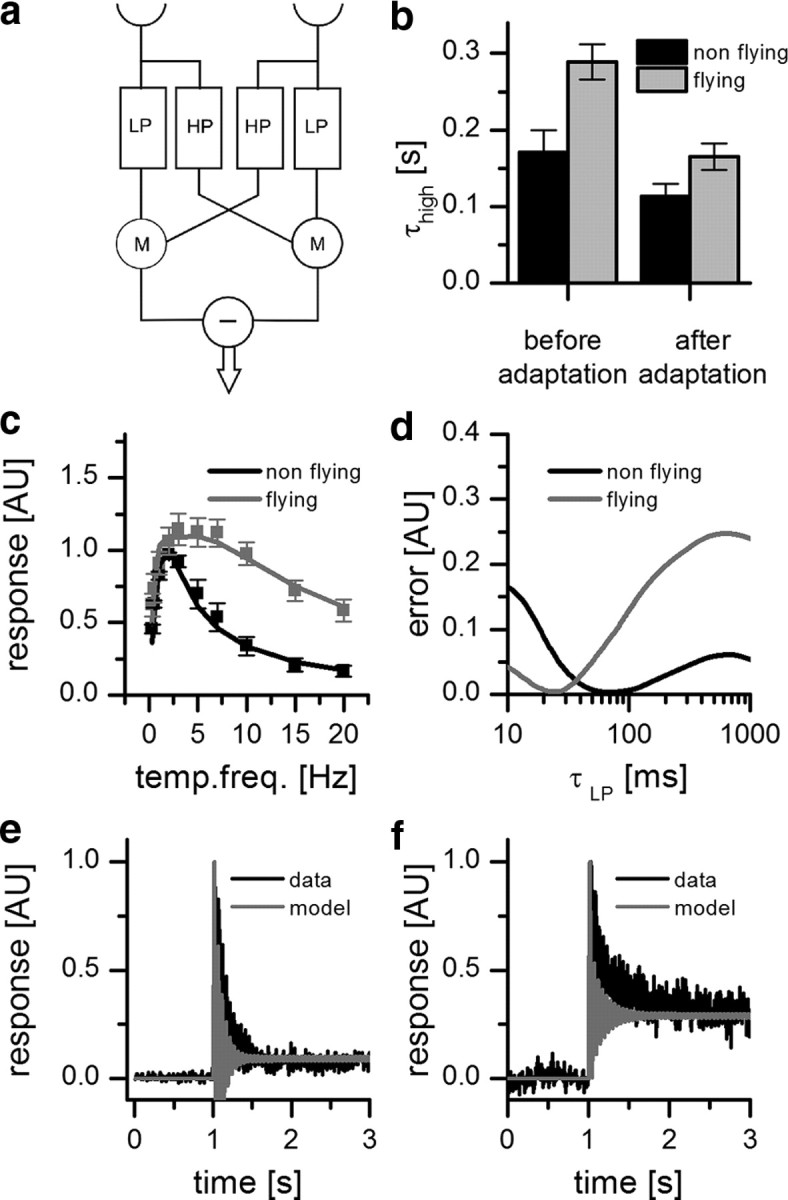
Flight changes the properties of the Reichardt detector. a, Structure of the Reichardt detector model considered here with high-pass (HP), low-pass (LP), and multiplication (M) stages. The high-pass time constant was estimated from measurements of the H1 response to a velocity impulse. The low-pass time constant was fitted. b, High-pass time constant before and after adaptation (nonflight: before adaptation = 0.171 s, after adaptation = 0.113 s; flight: before adaptation = 0.289 s, after adaptation = 0.165 s). Error bars indicate mean ± SEM of n = 5 flies. Adaptation led to a decrease of the high-pass time constant. c, Temporal frequency (temp. freq.) tuning curve of the mean response of H1 in nonflying and flying flies (black and gray squares, respectively; data from Fig. 4) together with the results of the Reichardt detector model (see equation). The response is normalized by the maximum response of resting flies. d, Quality of fit as a function of the time constant of the low-pass filter. The error was calculated as the mean squared difference between the model responses and the experimental data. During flight, the low-pass time constant decreased from 0.069 to 0.024 s. e, Peristimulus time histogram of the mean response of H1 recorded in a nonflying condition to a 20 Hz stimulation lasting for 3 s before (black line) together with the result of the simulation (gray line). f, Same as e but recorded from a flying condition.