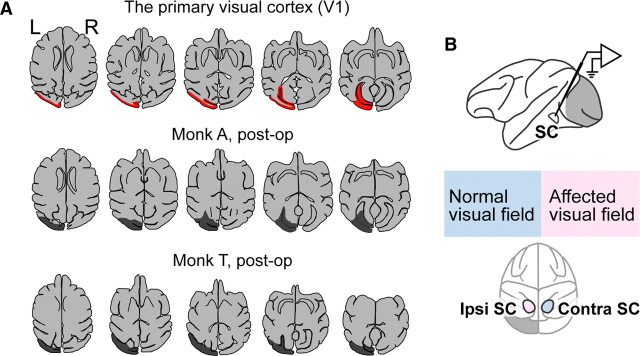
Figure 1.
V1 and the extent of the lesion (A) and the experimental conditions (B). A, Top, The figures are line images traced from axial slices of MR images acquired at 1 week before the lesion. V1 is denoted in red (monkey A). The estimated lesion site (depicted in dark gray) is overlaid on the line trace of the axial slices of the MR images acquired after the lesion in monkey A (middle) and in monkey T (bottom). B, Schema of the experimental conditions. In both monkeys, the left V1 was removed. Thus, the right hemifield was affected and the left visual field was normal.

