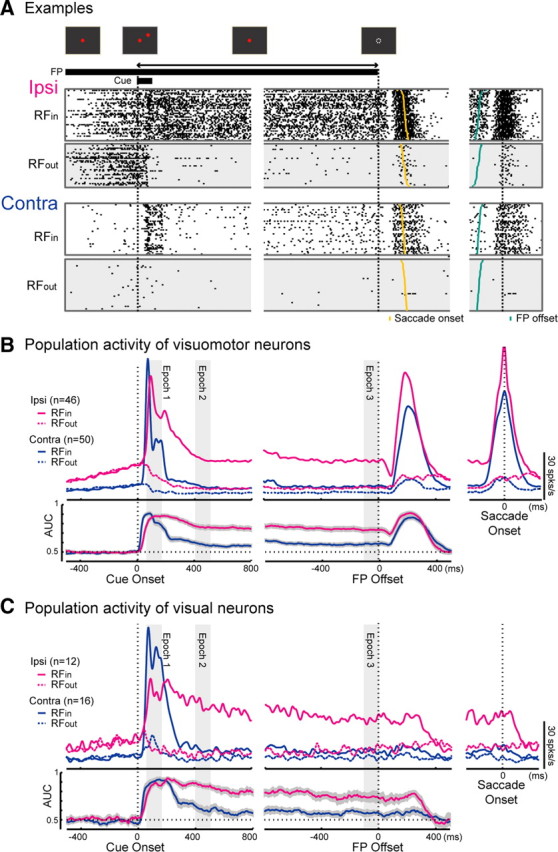
Figure 6.

Neuronal activity during the MGS task. A, Schema of the task and the raster plots of representative neurons in the ipsi SC (top row) and contra SC (lower row). B, C, Activity of visuomotor neuron and visual neuron populations. Top rows, Spike density functions; lower rows, time course of the AUC. The left columns show activity aligned with the cue onset, the middle columns show activity aligned with the FP offset, and the right columns show activity aligned with the saccade onsets. Shaded areas indicate epochs 1-3.
