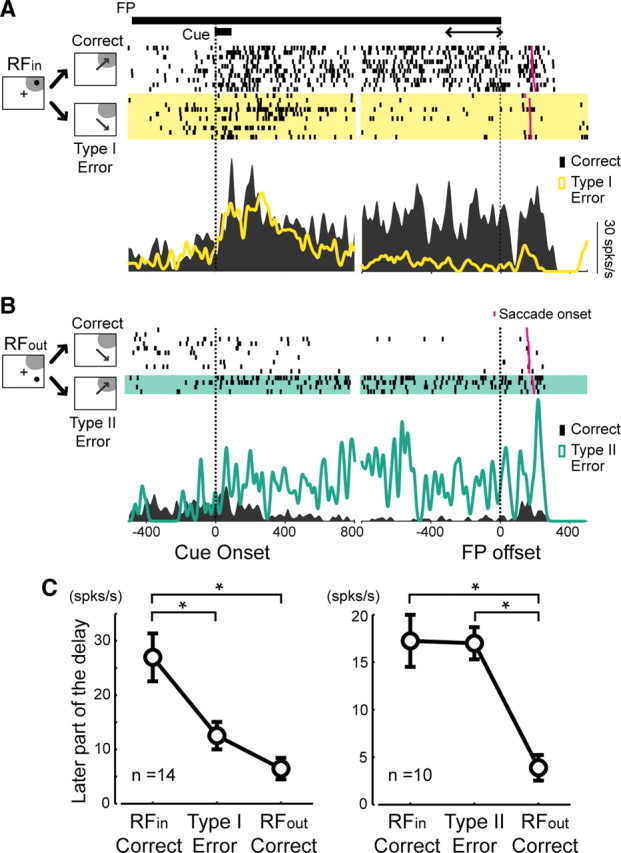
Figure 8.

Error analysis. A, B, Activity of a representative neuron in the RFin trials (A) and RFout trials (B). In this session, we used a smaller sized cue to collect a sufficient number of error trials. C, Population analysis of the error trials. Activity during the 300 ms of the last part of the delay period was compared between the correct trials and error trials. The visuomotor and visual neurons were merged. Data represent mean ± SE; *p < 0.05 according to Mann–Whitney U test with Bonferroni's correction for multiple comparison; spks/s, Spikes per second.
