
Figure 1.
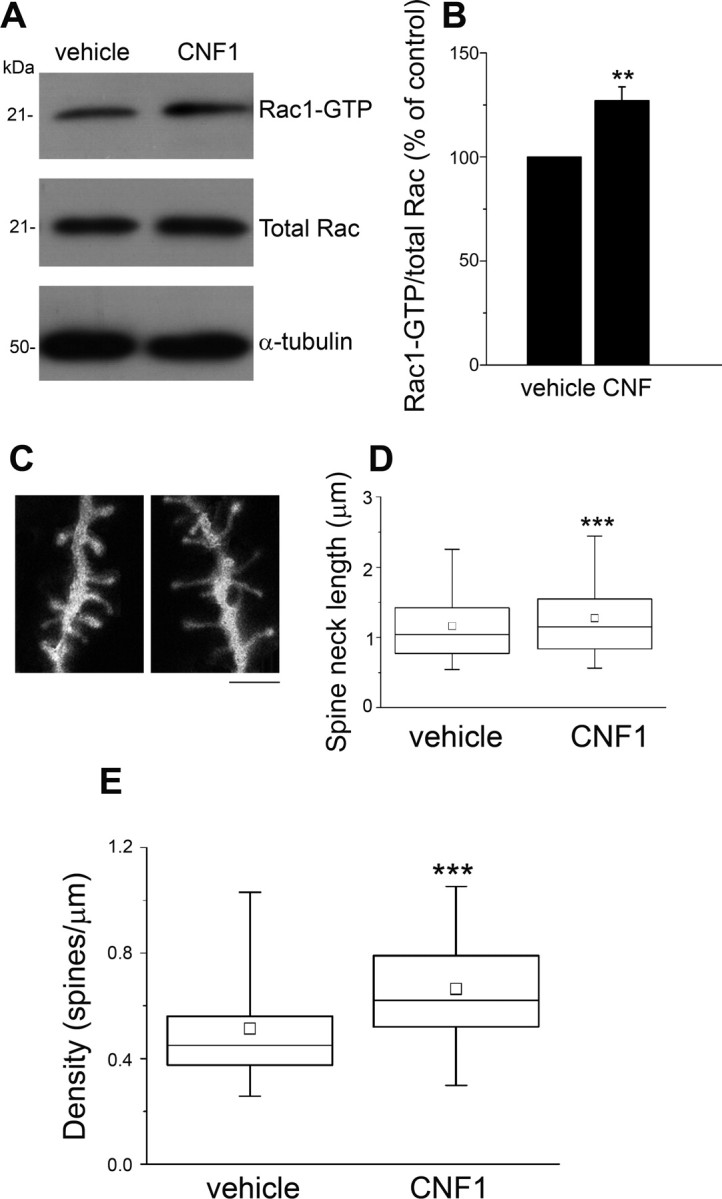
Enhanced Rac1 activation and increased spine density in the primary visual cortex after CNF1 treatment. A, Representative immunoblot showing the amount of activated Rac1 (Rac1–GTP) in protein extracts from visual cortex 10 d after CNF1 (or vehicle) injection. α-tubulin, Loading control. B, Quantification of the ratio between Rac1–GTP and total Rac in CNF1- and vehicle-treated rats (3 independent experiments). CNF1 significantly enhances Rac1 activation (paired t test, p < 0.01). C, Spine phenotype of visual cortex pyramidal neurons in animals treated with vehicle (left) or CNF1 (right). Scale bar, 1 μm. D, Box chart showing spine neck lengths for vehicle- and CNF1-treated neurons. The horizontal lines denote the 25th, 50th, and 75th percentile values. The error bars denote the 5th and 95th percentile values, whereas the square indicates the mean of the data. Spine neck length is significantly longer in CNF1-treated samples with respect to controls (Mann–Whitney rank-sum test, p < 0.001). E, Analysis of spine density in basal dendrites from layer II–III pyramidal neurons in visual cortex. Neurons of animals treated with CNF1 show a consistent and highly significant increase in the density of protrusions (Mann–Whitney rank-sum test, p < 0.001). The horizontal lines in the box chart denote the 25th, 50th, and 75th percentile values. The error bars denote the 5th and 95th percentile values, whereas the square indicates the mean of the data. We examined 2356 spines from 31 neurons and 1761 spines from 21 neurons in CNF1- and vehicle-treated rats, respectively. **p < 0.01; ***p < 0.001.