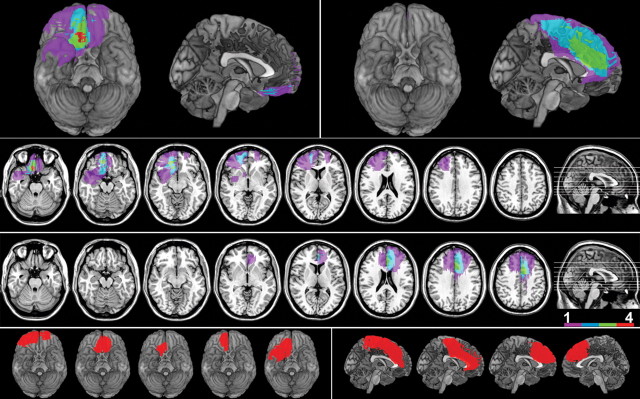
Figure 1.
Lesion overlap images superimposed on 3D reconstructions of the MNI brain (top left panel OFC group, top right panel dACC group) and on the same axial slices (middle panel upper row, OFC group; lower row, dACC group). Colors show degree of overlap, as indicated in the legend. The bottom panel shows a representative image for each individual subject, with those in the OFC group on the left, and the dACC group on the right.

