
Figure 3.
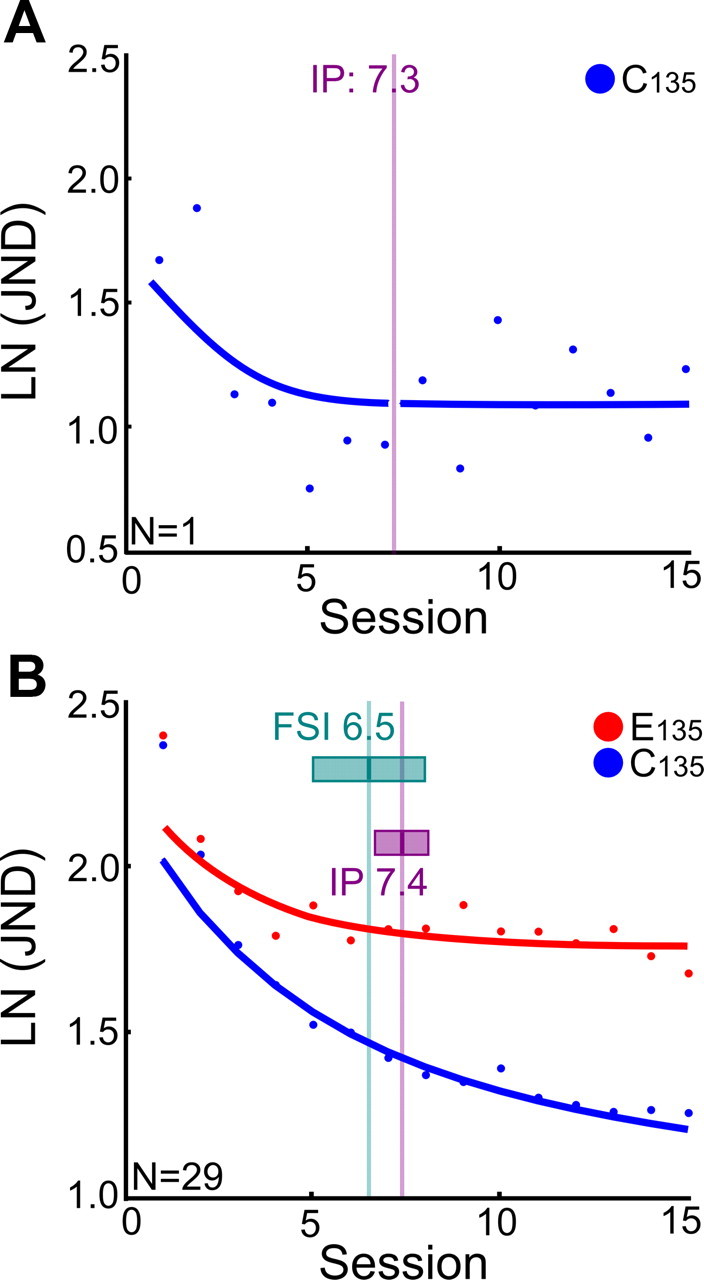
Significant interference starts at asymptotic learning. A, Illustration of the procedure to determine the beginning of asymptotic learning for the control condition at reference orientation 135° (C135) in a single participant. The beginning of asymptotic learning was defined as the IP of the learning curve. To determine the IP, we used a piecewise nonlinear regression fitting procedure (see Materials and Methods). The results of optimized nonlinear and linear fitting as well as the optimized transition point (the IP; vertical gray line) are shown. The IP was determined for all intervals between the first (P1) and second (P2) training periods for the C135 condition, and the resulting IP (29 participants) was on average at session 7.4. B, Comparison of the average inflection point with the average session in the course of learning at which the FSI is observed. The figure shows the data for the control condition C135 (blue dots) and the experimental condition E135 (red dots). For both conditions, the data were averaged over the different P1–P2 intervals (0, 0.5, 1, 3, 6, 24 h), as these experimental conditions did not significantly differ from each other. The fitted curves represent the average result of piecewise fitting for C135 (blue) and E135 (red). The vertical lines respectively mark the average session of FSI (green line) and average inflection point of the control condition C135 (IP, purple line) corresponding to the point at which initial fast learning is replaced with later asymptotic learning. While IP was based on estimates within each of 29 individuals, FSI was estimated in six groups of participants corresponding to the different P1–P2 delay conditions. The FSI was the first session in which paired-samples t tests between the JNDs from E135 and C135 showed a statistically significant difference. Averaged over the six P1–P2 delay conditions, this occurred at session 6.5. The two horizontal boxes show the size of the 95% confidence intervals, for both FSI and IP. Their overlap indicates that the distribution and the averages of the FSI and IP are not significantly different. In addition, a t test between the FSI and IP for the six different P1–P2 intervals showed that the average FSI is not significantly different from the average IP (t = −1.7399, df = 5, p = 0.1424; paired).