
Figure 3.
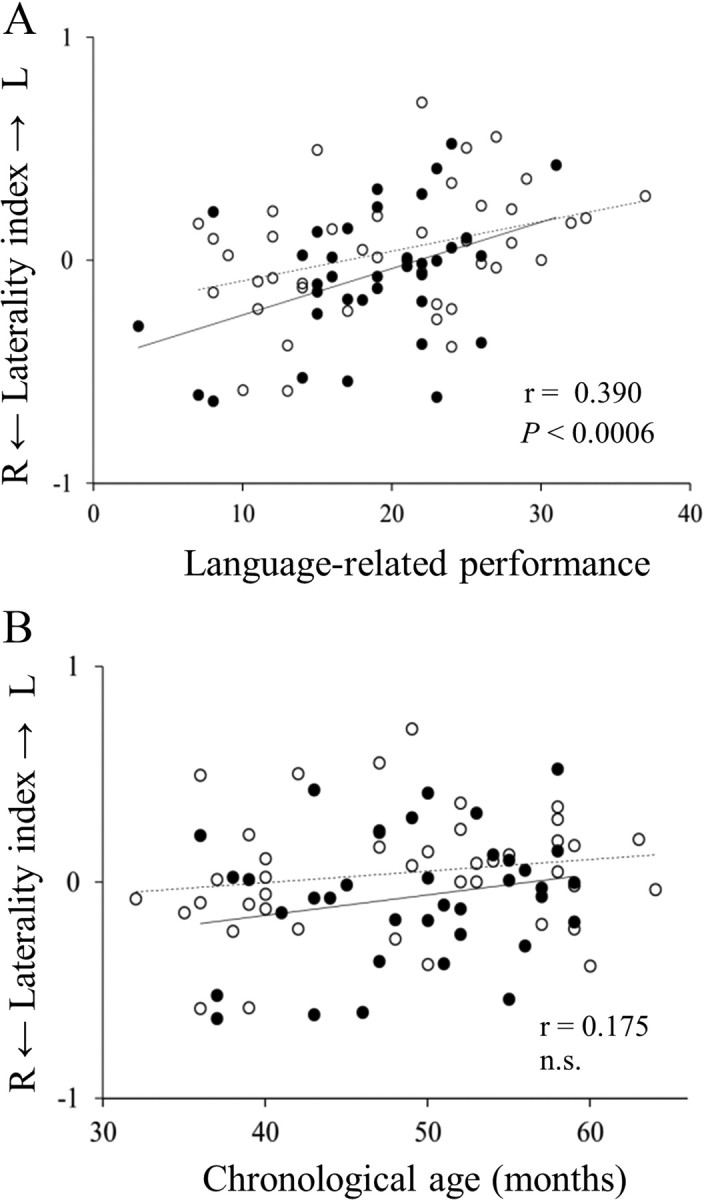
A, B, Scatter plot of laterality index of theta-2 band coherence (parietotemporal connectivity) and language-related cognitive performance (r = 0.390, p < 0.0006; A), and chronological age (r = 0.175, n.s.; B). ○, Boys (n = 36); •, girls (n = 42). Solid line, Regression line for boys; broken line; regression line for girls. L, left; R, right; n.s., not significant.