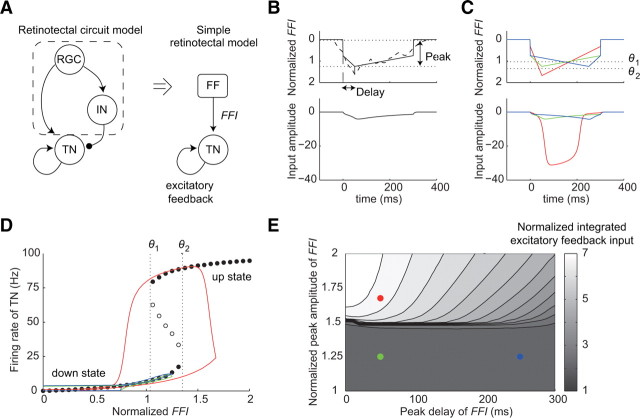
Figure 6.
Mechanism of amplification of the TN input. A, Schematic diagram of the simple retinotectal model (right). FFI in the simple retinotectal model corresponds to the sum of the RGC input and the IN input to the TN (left). B, Sample time profiles of FFI (top, solid line) and excitatory feedback input (bottom). Peak represents the maximum amplitude of FFI. Delay represents the duration between the peak time and the onset of FFI. Dashed line represents the FF input before training. C, Time profiles of FFI and excitatory feedback input. The green, red, and blue solid lines indicate the FFIs, which correspond to the FF inputs in Figure 5B in the trained direction before training, in the trained direction after training, and in the 180° direction after training, respectively. Dotted lines indicate the lower (θ1) and upper (θ2) transition thresholds of the excitatory feedback. D, Bifurcation diagram of the simple retinotectal model with respect to the parameter FFI. Solid and open circles indicate the firing rate of the TN at stable and unstable steady states, respectively. Each solid line indicates the superimposed firing rate profiles of TN against FFI. The line colors are consistent with those in C. Dotted lines indicate the lower (θ1) and upper (θ2) transition thresholds. E, Summary of the relationship among the peak amplitude of FFI, peak time of FFI, and integrated TN input. Solid circles indicate the point of the time profiles in C. The circle colors are consistent with those in C.

