
Figure 4.
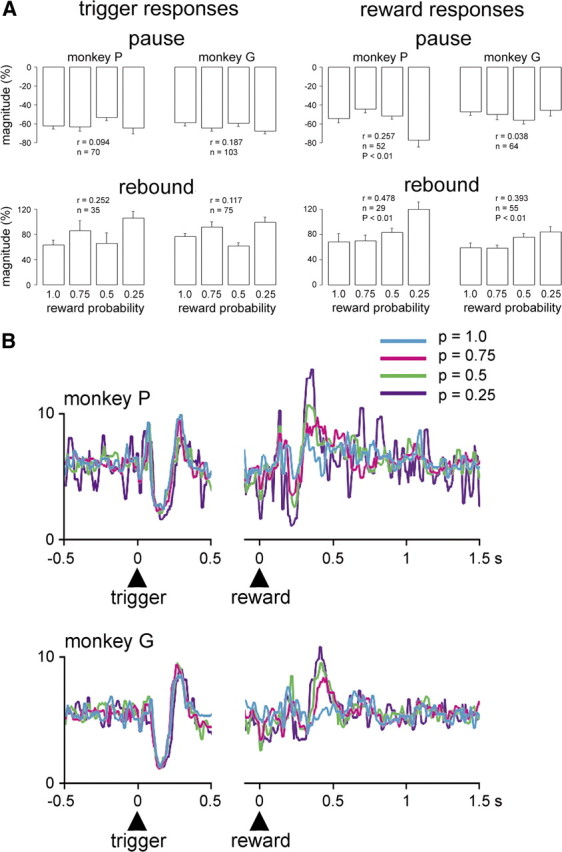
Modulation by reward probability of population responses of TANs to task events in rewarded trials. A, Comparison of magnitudes of the two components of TAN responses to the trigger stimulus and reward delivery in relation to different reward probability levels. The magnitude of initial pauses (monkey P) and later rebound activations (monkeys P and G) following reward delivery increased linearly with decreasing probability. In contrast, the magnitude of both response components to the trigger stimulus was not significantly correlated with the probability of reward. Each bar represents the mean ± SEM. Numbers of values at the different probability levels varied between 4 and 23 in monkey P and 11 and 29 in monkey G. r, Correlation coefficient. B, Population activities for all TANs recorded at each level of probability are superposed and separately referenced to the trigger stimulus (left) and reward (right). Numbers of neurons at p = 1.0, 0.75, 0.5, and 0.25 for monkey P are as follows: n = 32, 21, 29, and 10, respectively; for monkey G, n = 36, 31, 33, and 27, respectively. Vertical scale denotes impulses/s.