
Figure 2.
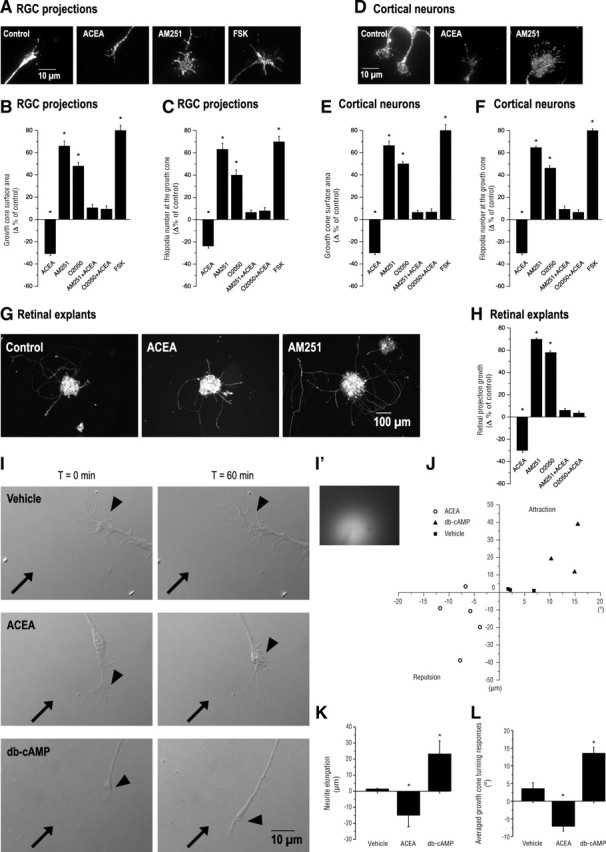
Pharmacological activation and blockade of the CB1R reorganizes the morphology of the GC and modulates axonal growth and navigation. A, D, Photomicrographs of retinal projection GCs cultured for 1 DIV (A) and of primary neurons cultured for 2 DIV (D) treated with a CB1R agonist (ACEA), an inverse agonist (AM251), an antagonist (O2050), or FSK. B, C, E, F, GC surface area and filopodia number analysis following a 60 min pharmacological treatment of retinal explant (B, C) and cortical neuron cultures (E, F). G, Photomicrographs of retinal explant cultures treated with ACEA or AM251. H, Quantification of retinal projection growth subsequent to treatments with CB1R agonist or inverse agonist. I, Photomicrographs of RGC projection GCs taken at t = 0 min and 60 min during GC turning assay experiments. Arrows indicate the direction of the microgradient, while arrowheads show the neurite stimulated. I′, Representative photomicrograph of the microgradient created during drug stimulation. J, Scatter plot analysis of GC behavior as a result of CB1R agonist, db-cAMP, or vehicle application. K, L, Quantifications of neurite elongation and GC turning responses following drug stimulation. Values are presented as means ± SEM. * indicates a significant change compared with the control group, p < 0.01 (B, C, E, F, H).