
Figure 3.
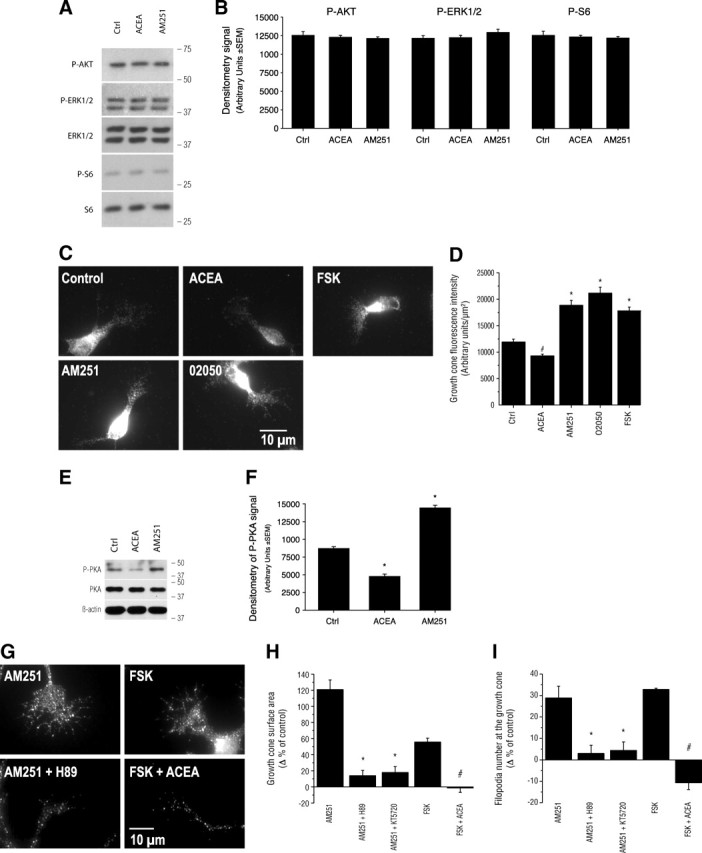
The CB1R modulates growth cone morphology through the cAMP/PKA pathway. A, Western blot analysis of downstream kinases previously suggested to modulate eCB action. Molecular weight markers are indicated on the right side of the panel. B, Quantification of the optical density for P-AKT, P-ERK1/2, and P-S6 following 10 min stimulation with ACEA or AM251. C, Photomicrographs of cortical neuron cultures immunolabeled for cAMP following 15 min stimulation with ACEA, AM251, O2050, or FSK. D, Quantification of cAMP fluorescence intensity at the GC. # and * indicate significant changes compared with the control group, p < 0.05 and p < 0.0001, respectively. E, Western blot analysis of PKA phosphorylation following 10 min stimulation with ACEA or AM251. Molecular weight markers are indicated on the right side of the panel. F, Quantification of the optical density for P-PKA. G, Photomicrographs of GCs treated with CB1R inverse agonist and agonist, FSK and PKA inhibitors. H, I, GC surface area and filopodia analysis subsequent to the addition of a CB1R inverse agonist and simultaneous inhibition of PKA or the activation of PKA and the addition of a CB1R agonist. Values are presented as mean ± SEM. * indicates a significant change compared with the AM251 group and # with the FSK group (p < 0.0001).