
Figure 4.
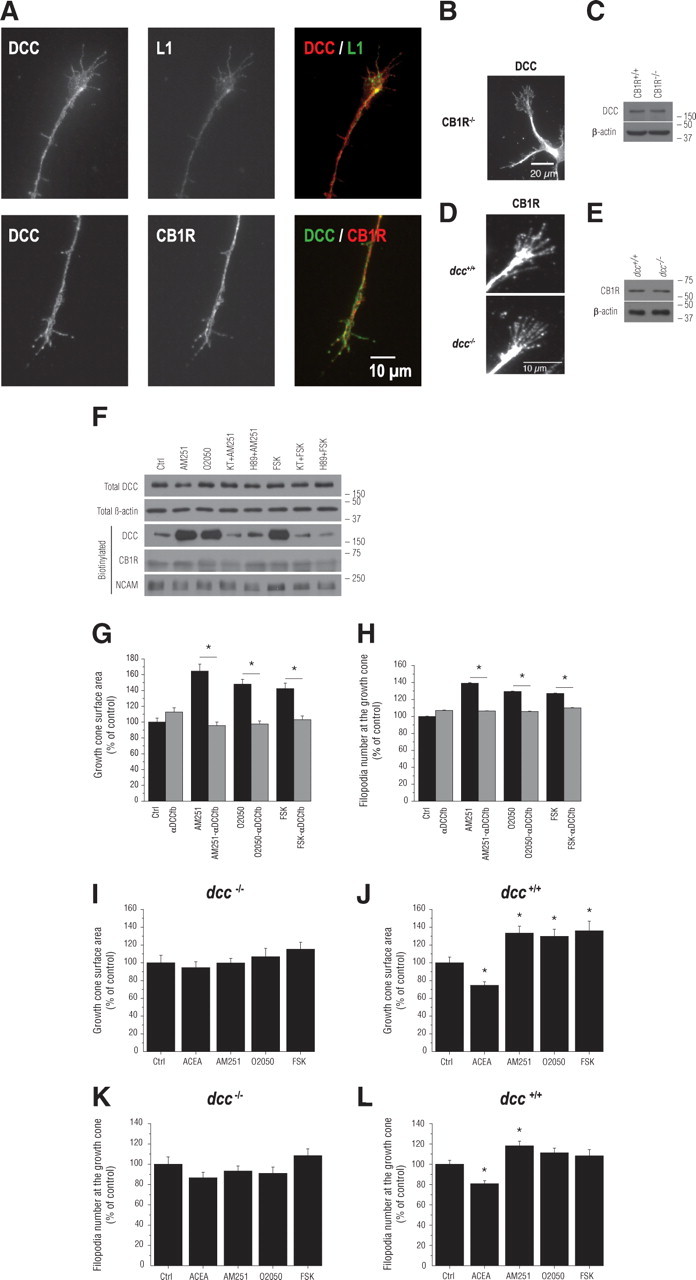
DCC is necessary for CB1R-induced reorganization of the GC. A, E14–E15 mice RGC projections immunolabeled for DCC, CB1R, and L1. B, C, Immunocytochemical and Western blot analysis of DCC expression in primary retinal neuron cultures obtained from CB1R−/− mice. D, E, Immunocytochemical and Western blot analysis of CB1R expression in primary neuron cultures obtained from dcc−/− mice. F, Total and biotinylated proteins analyzed by Western blot with antibodies directed against either DCC, β-actin, CB1R, or NCAM. For Western blots, molecular weight markers are indicated on the right side of the panel. G, H, GC surface area and filopodia number analysis of cortical neuron cultures treated with αDCCfb followed by the addition of either a CB1R inverse agonist or antagonist (AM251 or O2050, respectively) or FSK. I–L, GC surface area and filopodia number analysis of dcc−/− (I, K) and dcc+/+ (J, L) primary neuron cultures treated with either ACEA, AM251, O2050, or FSK. Values are presented as mean ± SEM. * indicates a significant change compared with the AM251, O2050, or FSK in G and H, and the control group in J and L (p < 0.05).