
Figure 5.
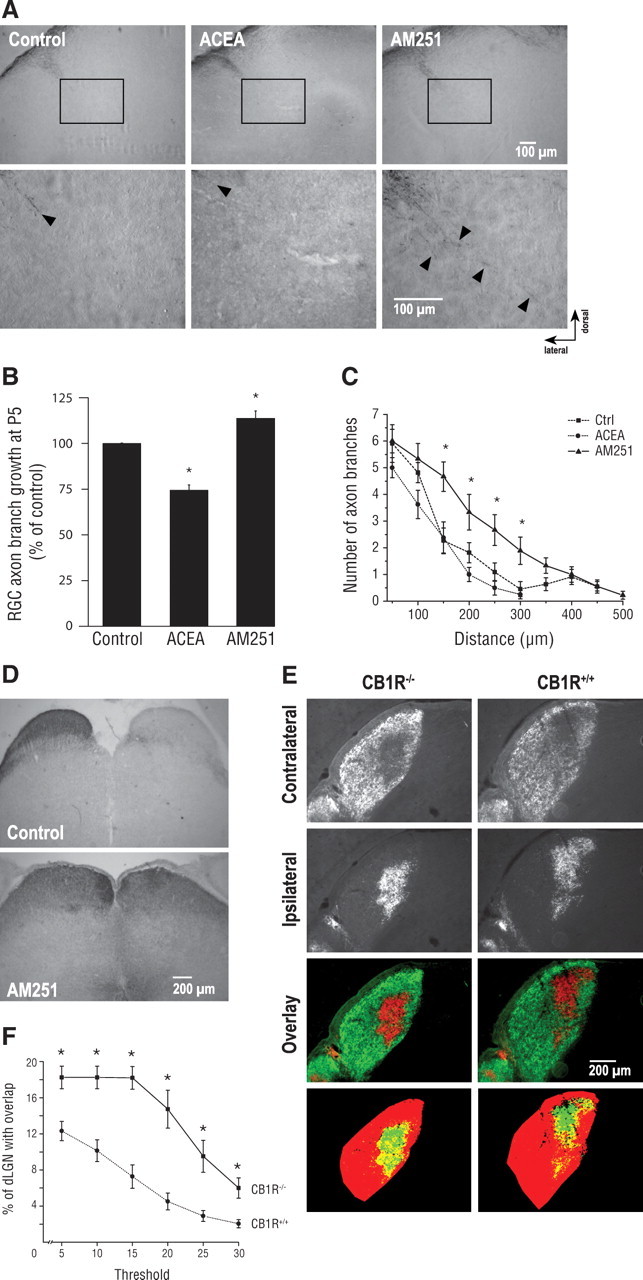
Pharmacological modulation of CB1R activity modulates retinal projection development in vivo. A, Photomicrographs of P5 retinal projections in the DTN in the control, ACEA, and AM251 groups. Lower panel shows higher magnification of retinal projections. B, C, Quantification of retinal projection development in the DTN; axon collateral growth (B) and collateral branch number (C) of treated groups compared with the control group. D, Photomicrographs of retinal projections in the SC in the control and AM251-treated groups. E, Retinogeniculate projection patterns visualized following CTb conjugated to Alexa-546 (CTb-546; red) and CTb-488 (green) injections into left and right eyes of CB1R−/− and CB1R+/+ adult mice. F, Quantification of the percentage of the dLGN receiving overlapping inputs in CB1R−/− and CB1R+/+ adult mice. Data are presented as means ± SEM. * indicates a significant change compared with the control group in C (p < 0.05) and the CB1R+/+ group in F (p < 0.005).