
Figure 6.
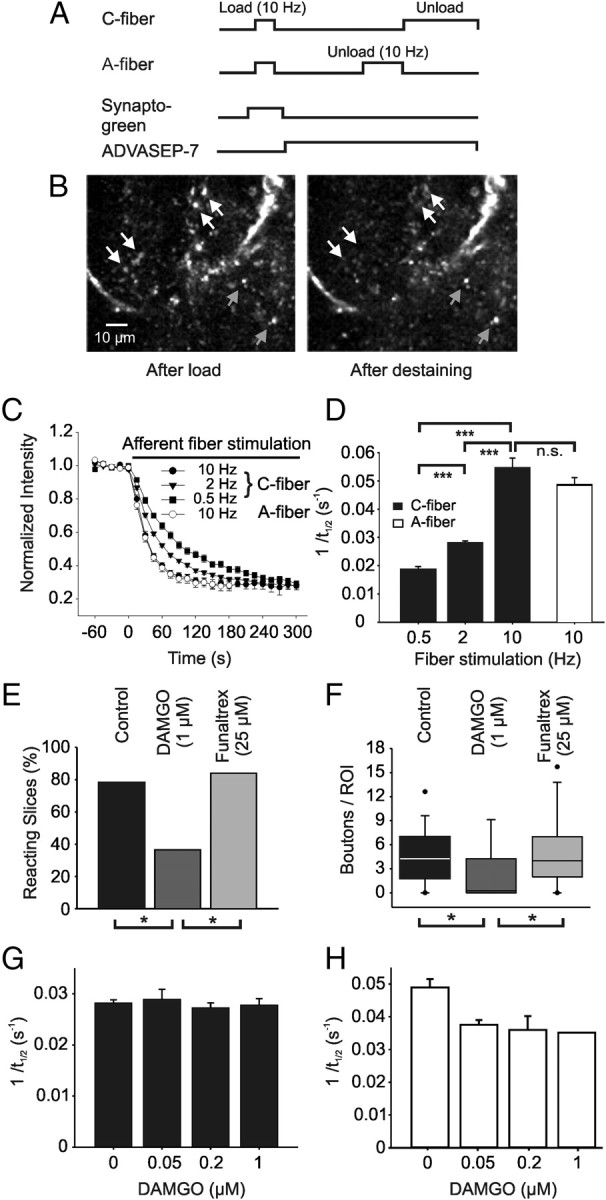
MOR agonist DAMGO reduced the amount of vesicle exocytosis in A- and C-fiber boutons but did not alter the kinetics of styryl dye destaining in C-fiber terminals. A, Protocol for determining kinetics of styryl dye release from afferent C-fiber terminals. Terminals were labeled by exposure to Synaptogreen during 10 Hz stimulation of the dorsal root for 2 min (load). ADVASEP-7 (100 μm) was applied to remove bound extracellular dye. Subsequent electrical stimulation in dye-free solution then released dye (unload). B, Fluorescent images of the same field within the superficial lamina of the spinal dorsal horn before and after an unloading C-fiber stimulation. White arrows show some of the unloading boutons; gray arrows point to puncta not affected by the stimulation. C, Decay of average intensity of the fluorescent puncta during unloading C-fiber stimulation using 0.5 Hz (black squares), 2 Hz (black triangles), and 10 Hz (black circles) stimulation, respectively. Destaining of puncta induced by stimulation (10 Hz) with A-fiber intensity shows similar kinetics (white circles). Each point represents the average of a total of 99–535 boutons from 5–32 different slices. D, Average rates of puncta unloading (1/t1/2) for the different stimulation frequencies applied with C-fiber (black bars) and A-fiber (white bar) intensity, respectively. E, Bath application of DAMGO (1 μm) reduced the proportion of slices reacting to dorsal root stimulation with C-fiber intensity at 2 Hz. Pretreatment with the specific MOR antagonist β-funaltrexamine (Funaltrex, 25 μm) abolished this effect. F, Box plot showing the decrease of the mean number of destaining C-fiber boutons per slice after DAMGO application and blockade of this effect by β-funaltrexamine. Frequency of unloading stimulation was 2 Hz. G, Bar chart showing average rates of puncta unloading (1/t1/2) during stimulation (2 Hz) with C-fiber intensity for different DAMGO concentrations. H, Bar chart showing average rates of puncta unloading (1/t1/2) during stimulation (10 Hz) with A-fiber intensity for increasing DAMGO concentrations. Number of slices tested: E, F, n = 32 for control, n = 11 for DAMGO, n = 25 for funaltrexamine, *p < 0.05; G, n = 25 for control, n = 4 for 50 nm, n = 6 for 200 nm, n = 4 for 1 μm DAMGO; H, n = 19 for control, n = 3 for 50 nm, n = 5 for 200 nm, n = 1 for 1 μm DAMGO.