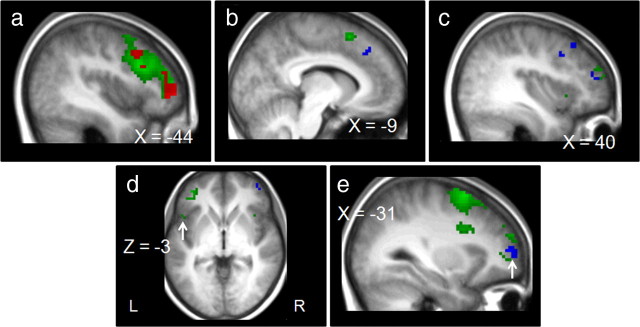
Figure 6.
Response-conflict-related (blue) and task-conflict-related (green) activation superimposed on anatomical slices averaged across participants. Response conflict is related to the contrast stimulus change correct trials minus catch correct trials. Task conflict is related to the contrast task change correct trials minus catch correct trials. a, Activation in the PM, IFJ, and DLPFC for task conflict (MNI coordinates of maximal random-effect Z scores, green, PM, x = −39, y = 9, z = 60, Z = 5.09; IFJ, x = −39, y = 15, z = 24, Z = 4.75; DLPFC, x = −39, y = 45, z = 3, Z = 4.94) and activation in the IFJ for response conflict (MNI coordinates of maximal random-effect Z scores, blue, x = −45, y = 18, z = 27, Z = 3.52). Overlapping activity is represented in red in the IFJ and the MFG (MNI coordinates of maximal random-effect Z scores, IFJ, x = −39, y = 15, z = 24, Z = 3.62; MFG, x = −36, y = 51, z = 27, Z = 4.46). b, Activation in the preSMA for task conflict and in the RCZ for response conflict (MNI coordinates of maximal random-effect Z scores, green, x = −9, y = 15, z = 57, Z = 4.03; blue, x = −6, y = 30, z = 39, Z = 3.70). c, Activation in the MFG for task conflict and for response conflict (MNI coordinates of maximal random-effect Z scores, green, x = 42, y = 54, z = 18, Z = 4.09; blue, x = 42, y = 27, z = 42, Z = 3.43). d, Activation in the inferior frontal gyrus for task conflict (MNI coordinates of maximal random-effect Z scores, x = −51, y = 15, z = −3, Z = 4.02). e, Activation in the frontopolar cortex for response conflict (MNI coordinates of maximal random-effect Z scores, x = −36, y = 54, z = 6, Z = 4.03).

