Figure 1.
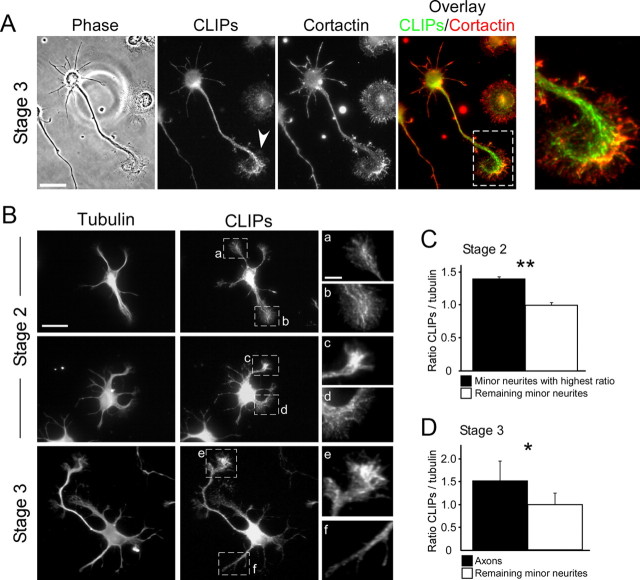
CLIPs are enriched in the axonal growth cone. A, Rat hippocampal neuron stained for CLIPs (CLIP-115 and 170) and cortactin. CLIPs bind to microtubule plus ends as comet-like structures. In the growth cone, CLIPs partially overlap with actin-rich regions. Enlarged image shows growth cone (marked region); arrowhead indicates enrichment of CLIPs in the axonal growth cone. Scale bar: 20 μm. B, Double-staining of CLIPs together with α-tubulin in unpolarized (stage 2) and polarized (stage 3) hippocampal neurons. a–f, Enlarged images show growth cones (marked regions). Whereas in 67 ± 4% of unpolarized stage 2 neurons CLIPs are distributed within all growth cones (a, b), CLIPs enrich in one minor neurite's growth cone in 33 ± 4% of stage 2 neurons (c, d) (n > 200 neurons from three independent experiments for each data point; p < 0.05 by Hampel outlier test). In 82 ± 3% of stage 3 neurons, CLIPs are enriched in axonal growth cones (e, f) (n > 150 neurons from three independent experiments for each data point; p < 0.001). Scale bars: 20 μm (full image), 5 μm (enlarged image). C, D, Quantifications of the ratio of CLIP/tubulin-staining in growth cones of stage 2 (C) and stage 3 (D) neurons. Values are normalized to the average of nonmaximal (C) or nonaxonal (D) growth cones for stage 2 and stage 3, respectively (n > 150 neurons from three independent cultures for each data point; *p < 0.05, **p < 0.01).

