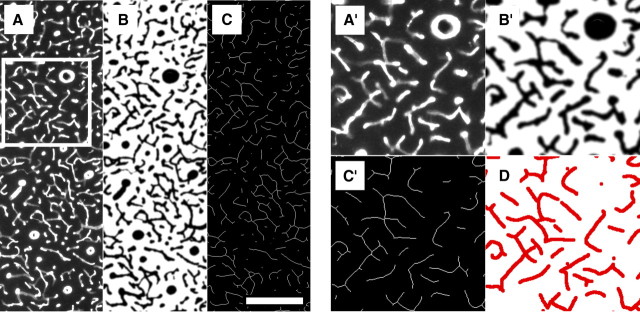
Figure 3.
Example of the image-processing protocol of the fluorescent blood vessel images from the same sample as in Figure 2. The anti-collagen immunohistochemistry produced images of high quality that allowed for the semiautomated approach in this study. A, Raw image of an anti-collagen fluorescently stained section. B, The same image as in A after visually guided semiautomated filtering, thresholding and binarization. C, The same image as in B after erosion of the vasculature to a line set where the blood vessels are represented by lines of a single pixel width. Scale bar, 200 μm. A′, B′, C′, Enlarged subareas indicated in A in greater detail in the different image modalities described previously. D, Manual delineation of the raw fluorescent micrograph shows almost no deviation from the course of the eroded lines in C′.

