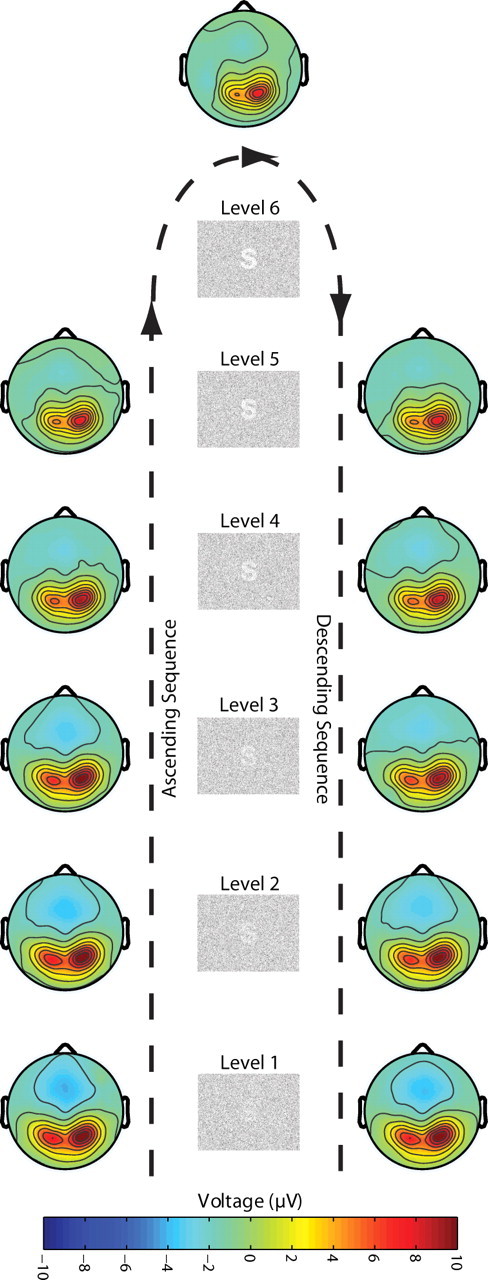
Figure 5.

P2 scalp topographies (main experiment). Scalp topographies of P2 amplitude per degradation level and ascending and descending sequence. Clear amplitudes decrements can be observed as a function of visibility.

P2 scalp topographies (main experiment). Scalp topographies of P2 amplitude per degradation level and ascending and descending sequence. Clear amplitudes decrements can be observed as a function of visibility.