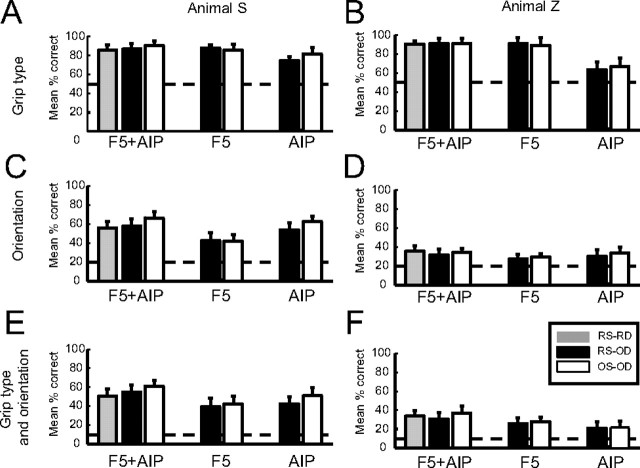
Figure 10.
Summary of decoding performance results. Each bar chart shows the mean classification accuracy across all sessions, analyzed separately for different spike-sorting methods (RS vs OS), decoding types (grip type vs orientation), and cortical areas (AIP vs F5). Actual observed real-time decoding (RD) results are included for comparison (RS-RD; gray bars). Respective chance levels are indicated with dashed lines. Error bars represent SD. A, Grip type decoding performance in Animal S. Classification of grip type was performed with high accuracy, particularly when using data from F5. Off-line spike sorting (OS) did not significantly increase decoding performance. C, Orientation decoding performance in Animal S. AIP performed significantly better than F5. E, Decoding performance for all 10 grasp conditions (type and orientation). In both C and E, performance was greater using data from both AIP and F5 than using either area alone. In addition, application of off-line spike sorting resulted in a moderate performance gain. B, D, F, Same analysis for Monkey Z.

