
Figure 11.
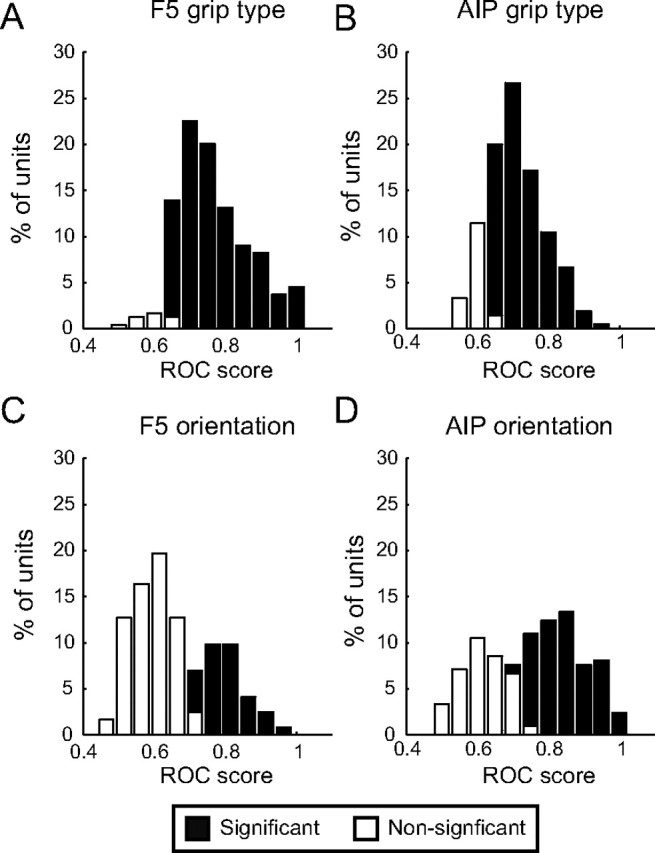
ROC analysis of classification accuracy for F5 and AIP multiunits. The ability of each significantly tuned multiunit to correctly classify grip type (precision vs power) and handle orientation (preferred vs nonpreferred) was measured in an ROC analysis. Each histogram shows the ROC score distribution in terms of the area under the curve values across the population; significant and nonsignificant ROC scores (Monte Carlo analysis) are represented by black and white bars, respectively. A, Grip type classification in F5. Ninety-five percent of tuned F5 multiunits could classify grip type with significant accuracy. B, Grip type classification in AIP. ROC score distribution was less skewed toward higher values, indicating lower accuracy of grip type classification in AIP compared to F5. C, Orientation classification in F5. In contrast to grip type, F5 multiunits performed relatively poorly at orientation classification, with a majority of nonsignificant ROC scores in the distribution. D, Orientation classification in AIP. Unlike F5, the majority of ROC scores were significant, indicating higher classification accuracy for orientation. Note that in both areas the ROC score distribution for orientation was bimodal.