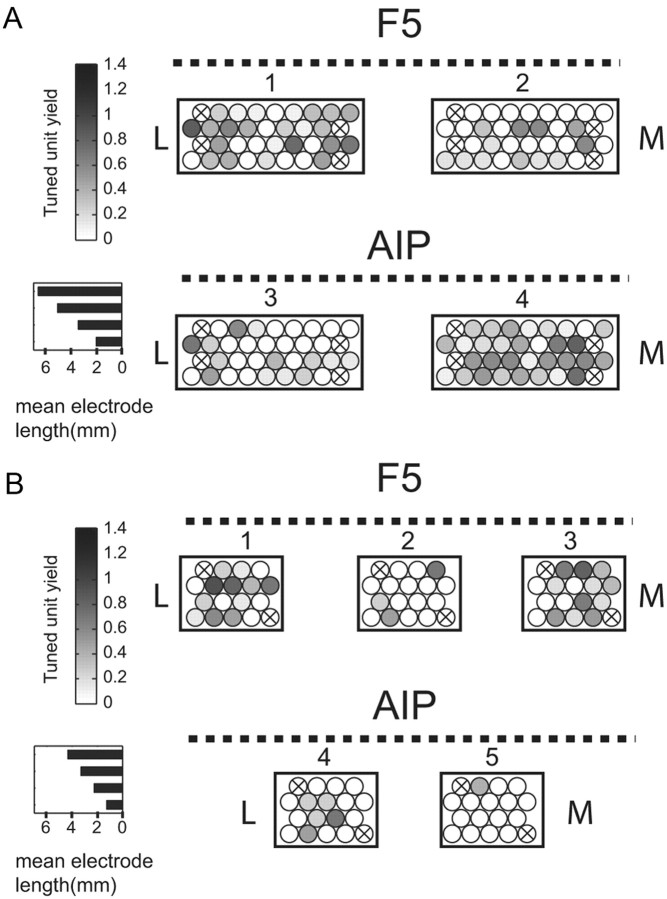
Figure 2.
FMA electrode layout and distribution of tuned multiunits. Rectangles represent a “top down” view of each FMA (looking down onto the cortical surface) with approximate electrode locations as circles. Electrodes within each row alternated in length (steps, 0.8 mm) with the mean length in each row displayed in the horizontal bar chart for each FMA type. Electrode shading represents the yield (mean number) of tuned multiunits per session (grip type or orientation) across all recording sessions. Crossed-out electrodes are reference and ground. Dashed lines represent the approximate sulcus location (arcuate for F5, intraparietal for AIP) relative to the FMA. FMA numbering is as in Figure 1. M, Medial; L, lateral. A, Distribution of tuned units for Animal S. B, The same distribution for Animal Z.

