
Figure 3.
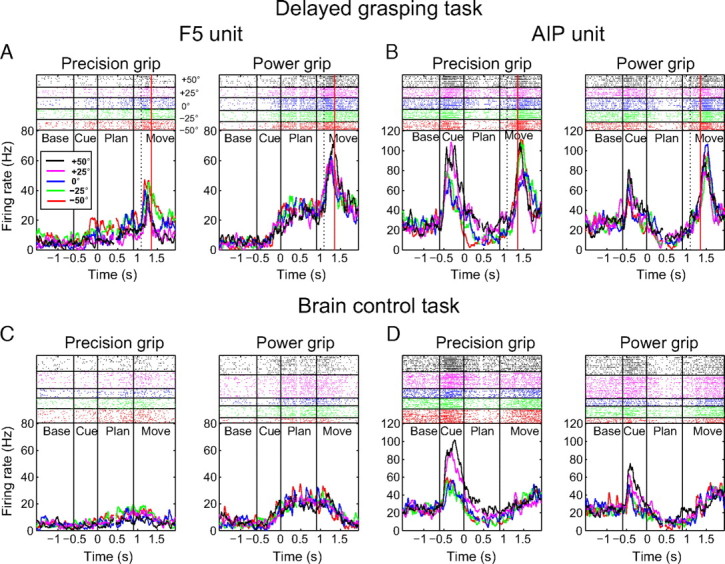
Firing rate histograms and raster plots of two example multiunits from F5 and AIP during the delayed grasping task and the brain control task. A–D, Each panel shows precision grip trials (left) and power grip trials (right) separately. Each color represents a particular handle orientation in the spike rasters (top) and for the averaged firing rates (bottom). The dashed line within each movement epoch represents the mean time of hand rest release, and the solid red line indicates the mean time of handle contact. All trials are doubly aligned to the end of the cue epoch (at 0 s) and the start of movement (at 0.9 s); gaps in the curves and rasters (at ∼0.4 s) indicate realignment. A, Multiunit recorded in F5 in the delayed grasping task showing tuning for grip type during the planning period, with greater firing rates for power grip trials than precision grips. B, Multiunit recorded in AIP in the delayed grasping task showing orientation tuning during cue, planning, and movement. C, Activity of the same F5 unit as in A, but during brain control trials. Note the similar activity modulation for grip type during the planning phase, but a lack of movement-related activity. D, Activity of the same AIP unit as in B during brain control trials. Note the separation of average firing rate profiles according to handle orientation during the cue and planning epochs and the absence of movement-related activity.