Figure 7.
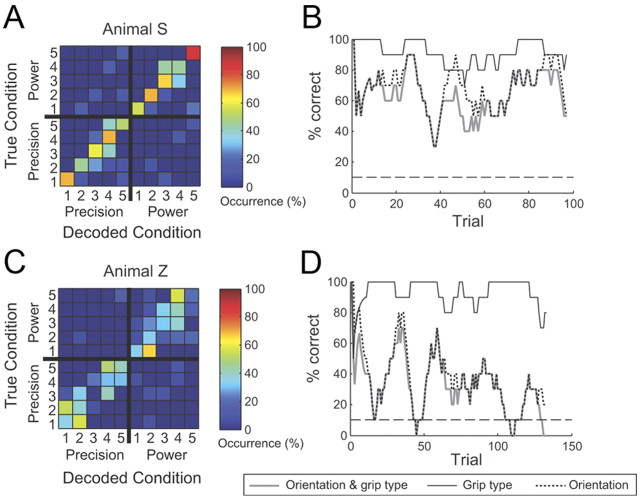
Two example sessions of real-time decoding. A–D, One session from Animal S (A, B) and one from Animal Z (C, D). A, Confusion matrix depicting the decoding performance for grip type (precision vs power) and handle orientations (here labeled 1–5), i.e., 10 grasp conditions in total. The color code indicates the percentage of how often a particular decoding condition was predicted for a given instructed (true) condition. Correct classifications therefore line up along the diagonal. Note that classification errors were mainly made between neighboring orientations but rarely between grip types. B, Trialwise classification performance for the same session as in A. Classification accuracy was measured using a sliding window that averaged performance in the previous 10 trials. Performance is displayed separately for all 10 conditions (thick gray line), grip type only (thin black line), and orientation only (dotted line). Note, however, that the monkey always performed the full 10-condition decoding task. The dashed line shows the chance level for 10-condition decoding. Performance errors were mainly due to errors in orientation classification rather than grip type. C, D, The same analysis for a session from Animal Z.

