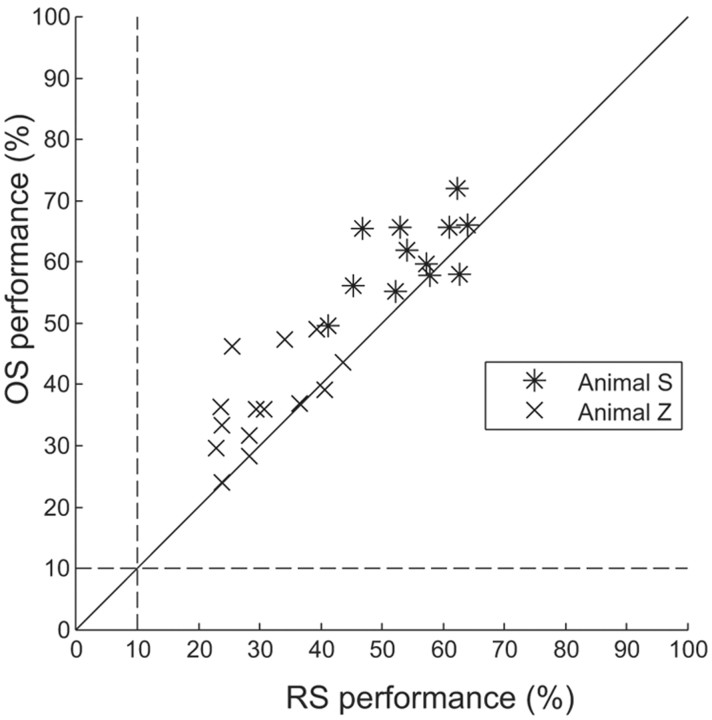
Figure 9.
Scatter plot comparing mean decoding performance using RS versus OS data. In both animals, most points fall above the unity line, but close to it, indicating that decoding performance was only marginally improved by performing off-line spike-sorting procedures (mean increase, 6.25 percentage points).

