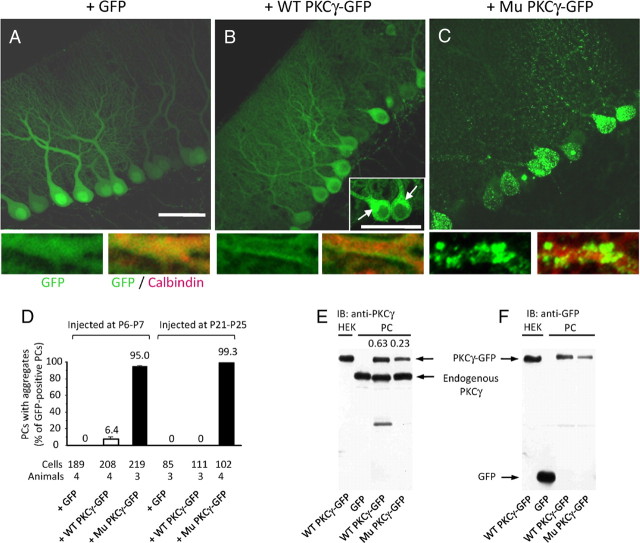
Figure 2.
Aggregate formation in PCs expressing mutant PKCγ-GFP. A–C, GFP fluorescence images of PCs from mice treated at 1 week of age with lentiviral vectors expressing GFP (A), wild-type (WT) PKCγ-GFP (B), or mutant (Mu) PKCγ-GFP (C). Arrows in the inset of B show wild-type PKCγ-GFP in cis-Golgi. Lower small panels are enlarged images of PC dendrites, and the left and right images show native GFP fluorescence and GFP plus immunofluorescence for calbindin, respectively. Scale bars, 50 μm. D, Ratios of PCs with aggregates to total PCs from mice that received an injection of lentiviral vectors expressing GFP, wild-type PKCγ-GFP, or mutant PKCγ-GFP at 1 week of age or 4 weeks of age. The number of cells and animals examined are presented below the graph. E, F, Western blot results showing the amount of wild-type and mutant PKCγ-GFP and endogenous PKCγ in PCs. GFP or wild-type or mutant PKCγ-GFP was lentivirally expressed in PCs in vivo before Western blot analysis. The membrane was immunoblotted (IB) with anti-PKCγ (E) and anti-GFP (F) antibodies. Numbers above the right two lanes in (E) indicate ratios of wild-type or mutant PKCγ(-GFP) to endogenous PKCγ; the ratios of the band volume were quantified from enhanced chemiluminescence.

