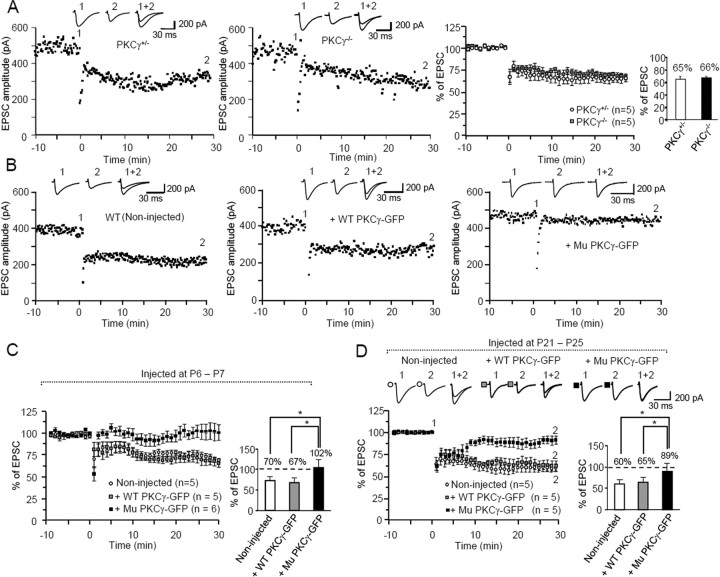
Figure 4.
Deficient cerebellar LTD in PCs expressing mutant PKCγ-GFP. Conjunctive stimulation of PF (1 Hz, 30 s) with depolarization was applied at time 0. A, Expression of LTD in PKCγ-deficient PCs. Left and middle graphs show representative time course of changes in PF EPSC amplitude after conjunctive stimulation. PF EPSCs were recorded in P30–P31 PCs from heterozygous (PKCγ+/−) (left) and homozygous (PKCγ−/−) (middle) PKCγ-knock-out mice. Right graph depicts summary of the time course of changes in PF EPSC amplitude in PCs from heterozygous and homozygous PKCγ-knock-out mice. The bar graph next to the averaged graph shows the percentage of the EPSC amplitude 30 min after conjunctive stimulation relative to the baseline value. B, Representative examples of changes in PF EPSC amplitude after conjunctive stimulation. PF EPSCs were recorded in P28 PCs from noninjected controls (left) and age-matched PCs expressing wild-type PKCγ-GFP (middle) or mutant PKCγ-GFP (right) from wild-type mice injected at P6–P7. C, D, Summary graphs showing the time course of changes in PF EPSC amplitude (left) and the percentage of the EPSC amplitude 30 min after conjunctive stimulation relative to the baseline value (right). PF EPSCs were recorded in PCs from noninjected mice or PCs expressing wild-type (WT) or mutant (Mu) PKCγ-GFP from mice that received a lentiviral injection at P6–P7 (C) or P21–P25 (D). In summarized graphs (A, C, D), the averaged amplitudes of PF EPSC over 1 min were normalized to the baseline value, which was the average of the 1 min responses (six traces) that occurred just before conjunctive stimulation. The numbers (n) of tested PCs and animals (number of tested PCs equals the number of animals examined) are indicated in the graph. Insets 1, 2, and 1 + 2 in A, B and D show representative traces of PF EPSC just before conjunctive stimulation (1) and 30 min after conjunctive stimulation (2), as well as a superimposed image (1 + 2). Asterisks indicate statistically significant differences determined by one-way ANOVA followed by Tukey's post hoc test; *p < 0.05.

