Figure 7.
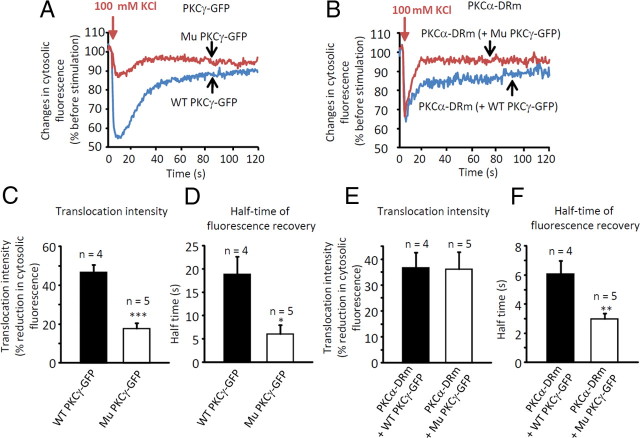
Distinct alteration of membrane residence time of PKCα-DRm in the presence of mutant PKCγ-GFP. A, Time course of changes in cytosolic fluorescence from mutant (Mu) or wild-type (WT) PKCγ-GFP in cultured PCs upon 100 mm KCl application. B, Time course of changes in cytosolic fluorescence from PKCα-DRm in the presence of mutant or wild-type PKCγ-GFP in cultured PCs upon 100 mm KCl application. Note the disrupted translocation/recovery kinetics of mutant PKCγ-GFP (A) and impaired recovery kinetics of PKCα-DRm in the presence of mutant PKCγ-GFP (B). C, E, Summary of percentage reduction of cytosolic PKCγ-GFP (C) or PKCα-DRm (E) fluorescence intensity. D, F, Summary of half-time of PKCγ-GFP (D) or PKCα-DRm (F) fluorescence recovery. The number of cells examined is presented above each bar. Asterisks indicate statistically significant differences as measured by unpaired t tests; *p < 0.05, **p < 0.01, ***p < 0.001.

