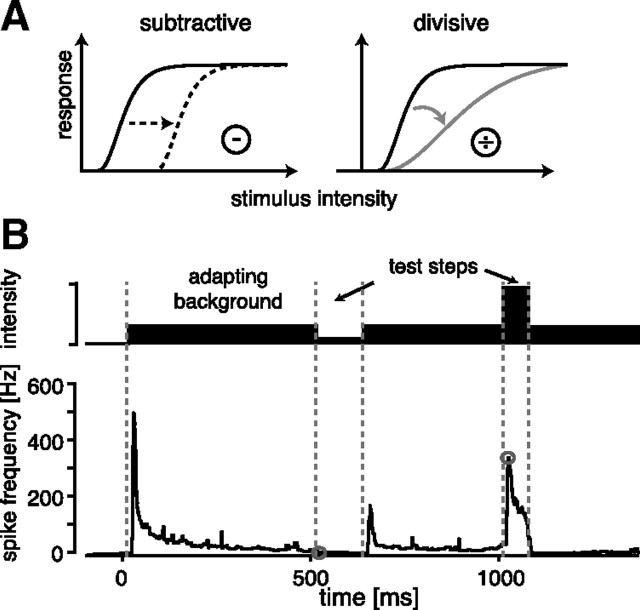
Figure 1.
Evaluation of response curves. A, Two effects of adaptation on response curves as discussed in the present work: subtraction (left) shifts the responses along the input axis, while division (right) scales the slope of the curve. Note that both operations act on the input axis of the response curve, thereby preserving the range of response values available for coding. Another possibility would be divisive scaling of the response axis, which alters the slope but also causes a decrease of the maximal response. Here, we only consider operations on the input axis, pictured in A. B, Stimulation paradigm. To construct onset-response curves at specific adaptation levels, a background stimulus was presented and short, rectangular steps of the stimulus amplitude introduced (B, upper trace). These test steps were gated with 2 ms rise and fall times (not visible at this scale). The background stimulus was long enough to fully adapt to this stimulus. Neural responses for each test intensity were quantified as the spike-frequency responses at the beginning of the test pulses, indicated by the gray circles in B. Spike frequency was quantified as the mean of the inverse of the interspike intervals in all trials, separately for each time step (resolution 1 ms). The onset-response curve was constructed from these responses as a function of the intensity of the corresponding test stimuli.

