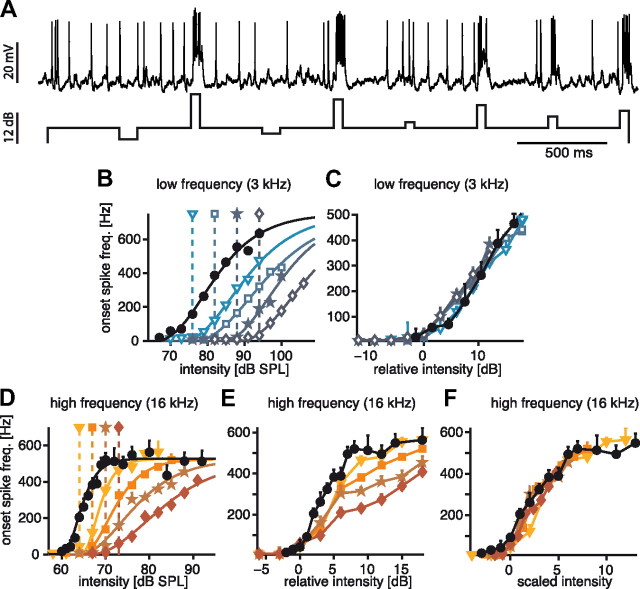
Figure 2.
Effect of adaptation on onset-response curves at two different carrier frequencies. A, Example voltage trace of an AN2 response to the adaptation paradigm (see Fig. 1). The stimulus envelope of the amplitude modulation of an acoustic stimulus is displayed below. Both intensities above and below the adapting background were presented to obtain the full response curves. B, Example of response curves of an AN2 after adaptation to different background intensities at a carrier frequency of 3 kHz. The black dots and lines represent the onset-response curves without adaptation. Colored lines and symbols depict onset-response curves after adaptation to the background intensity indicated by the respective symbols above the graph. The onset-response curves were evaluated at the onset of the amplitude steps in the bottom of A. C, Same data as B, but with the intensity relative to the respective adapting background for each adapted response curve (adapter level was set to 0 dB). D, E, Adapted response curves for a carrier frequency of 16 kHz, for explanation see (B, C). F, Since subtracting the background did not eliminate all of the adaptation effects at 16 kHz (D), the input intensity was additionally divided by the adaptation background to show the divisive effect of adaptation. Error bars indicate SD, solid lines in B and D stem from hyperbolic tangent fits to the data. The color scheme used here (open blue for low-frequency stimulation, closed red/orange for high-frequency stimulation) is consistently used in all subsequent figures.

