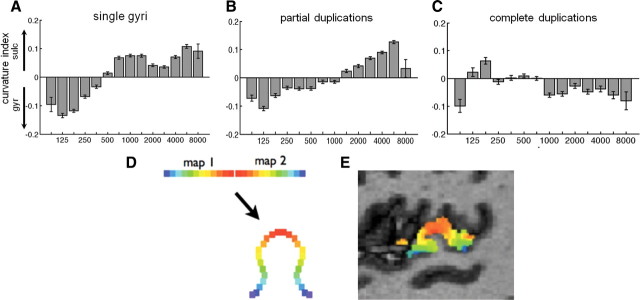
Figure 5.
Tonotopy relative to curvature of HG. Curvature index versus preferred frequency values of all surface voxels within the two primary tonotopic maps, across all subject's hemispheres with a single HG (A), partial duplication (B), and complete duplication (C). Positive curvature values indicate concavity (sulcal), and negative values indicate convexity (gyral). Systematically, low frequencies tend to be represented on a gyrus (HG) and high frequencies within adjacent sulci. Error bars indicate SEM. D, Diagram of a single gyrus showing how a fold between mirror symmetric maps brings equivalent topographic points on the two maps closer together in space. E, Actual tonotopy data on HG from a sample subject for comparison, sagittal slice view.

