Figure 5.
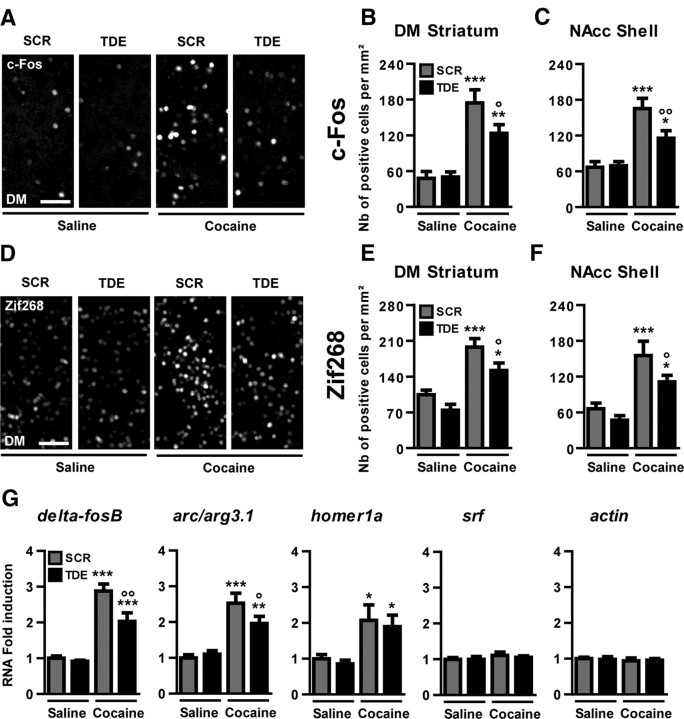
Inhibition of Elk-1 phosphorylation alters SRE-driven gene regulation by cocaine in vivo. Immunohistochemical detections of c-Fos (A–C) and Zif268 (D–F) were performed in the DM and the NAcc shell 60 min after an acute treatment with saline or cocaine (10 mg/kg) in mice pretreated with TDE or SCR (8 mg/kg) 60 min before cocaine treatment. Note the increased immunoreactivity of c-Fos (A) and Zif268 (D) in mice pretreated with SCR before cocaine administration. Note also the decreased immunoreactivity in TDE pretreated cocaine groups. Scale bars, 50 μm. G, Real-time quantitative PCR was performed to evaluate levels of ΔfosB, arc/arg3.1, homer1a, srf, and actin mRNA 45 min after an acute cocaine injection in mice pretreated for 1 h with either TDE or SCR. B, C, E, F, Data (means ± SEM; n = 8 mice per group) were analyzed using one-way ANOVA (between subjects) in the DM for c-Fos (F(3,28) = 16.54, p < 0.001) and Zif268 (F(5,21) = 16.80, p < 0.001) and the NAcc shell for c-Fos (F(3,28) = 14.51, p < 0.001) and Zif268 (F(3,28) = 10.86, p < 0.001), followed by post hoc comparisons (Newman–Keuls test). *p < 0.05, **p < 0.01, ***p < 0.001, cocaine groups versus saline group; °p < 0.05, °°p < 0.01, TDE pretreated cocaine group versus SCR pretreated cocaine group. G, Data (means ± SEM; n = 5–6 mice per group) were analyzed using one-way ANOVA (between subjects) for ΔfosB (F(3,19) = 34.87, p < 0.001), arc/arg3.1 (F(3,19) = 16.64, p < 0.001), homer1a (F(3,19) = 5.349, p < 0.01), srf (F(3,19) = 0.581, NS), and actin (F(3,19) = 0.163, NS), followed by post hoc comparisons (Newman–Keuls test). *p < 0.05, **p < 0.01, ***p < 0.001, cocaine groups versus saline group; °p < 0.05, °°p < 0.01, TDE pretreated cocaine group versus SCR pretreated cocaine group.

