Figure 4.

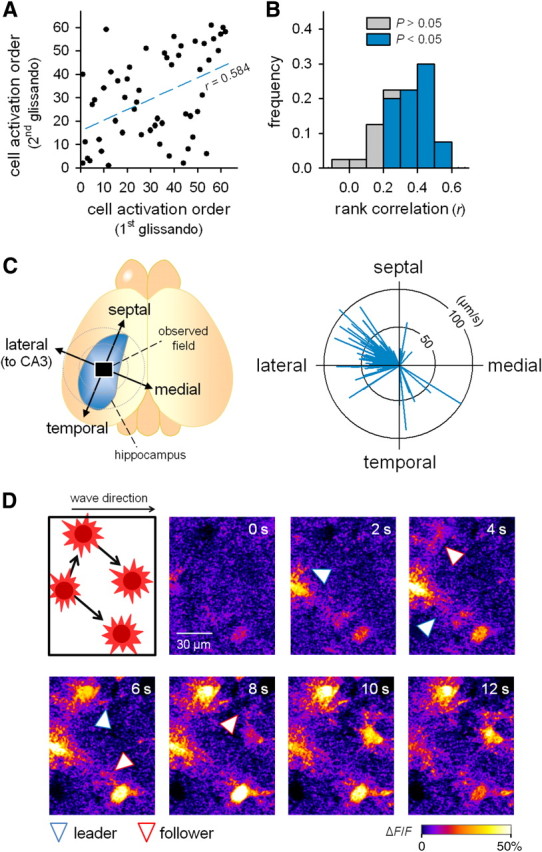
Glissandi propagate from foot to foot in the CA1 to CA3 direction. A, Representative sequential plot showing the activation order of astrocytes in two successive glissandi (first glissando and second glissando). Each dot indicates a single astrocyte. The movie was obtained at 10 Hz to determine the precise order of cell activation. Spearman's rank correlation coefficient (r) was 0.584. B, Summary of the correlation coefficients for all pairwise data. Among 40 pairs in five glissandi, 32 (80%) exhibited a significance level of 5% for the rank correlation (colored). C, The direction and speed of glissandi were calculated using a linear regression and vector-plotted in the right circle graph. Each vector represents a single glissando, and its orientation and length indicate the direction and speed of propagation (n = 38 glissandi, 8 mice). D, Two-photon imaging with a higher magnification and a higher numerical aperture objective (25×, 1.05 NA) revealed that calcium activity propagated from a leader foot of one cell to the neighboring follower foot of another cell during the propagation of a glissando. The blue and red arrowheads indicate leader feet (donors) and follower feet (recipients), respectively. Similar microscopic patterns of propagation were observed in all three animals tested.
