
Figure 7.
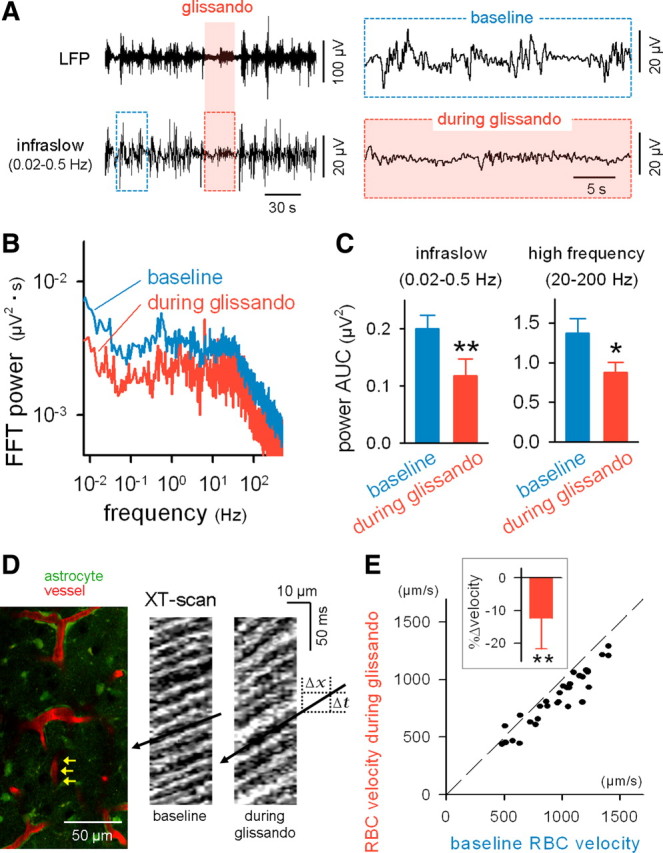
Glissandi are correlated with a reduced infraslow potential and a slowed cerebral vessel flow. A, LFPs were recorded from the CA1 stratum radiatum while monitoring the glissandi. The raw LFP trace (top) was band-filtered (0.02–0.5 Hz) to extract infraslow fluctuations (bottom). Glissandi were generated during the shaded period. The boxed regions are expanded in the insets. B, Fast Fourier transform (FFT) of LFPs during periods of baseline and glissandi. C, During glissandi, the area under the curves (AUCs) of the FFT power decreased in the ranges of 0.02–0.5 and 20–200 Hz. *p < 0.05, **p < 0.01 versus baseline (n = 5). Error bars indicate SD. D, FITC-dextran was intravenously injected, and astrocytic calcium and blood vessel flows were monitored simultaneously (left). The flow of individual RBCs was measured from capillaries (such as indicated by arrows). Two right kymographs show XT-line-scanned images along the longitudinal axes of a capillary during periods of baseline and glissandi. The RBC flow is observed as oblique shadow bands, and the RBC velocity is calculated as the slope ΔX/ΔT. E, Comparison of the RBC velocity between periods of baseline and glissandi. The dots indicate the data obtained for single capillaries (i.e., single glissandi), and the broken line indicates the diagonal. The inset shows the glissando-induced mean change in RBC velocity. **p < 0.001 versus baseline, t(31) = 7.7, paired t test (n = 32 events, 5 mice). Error bars indicate SD.