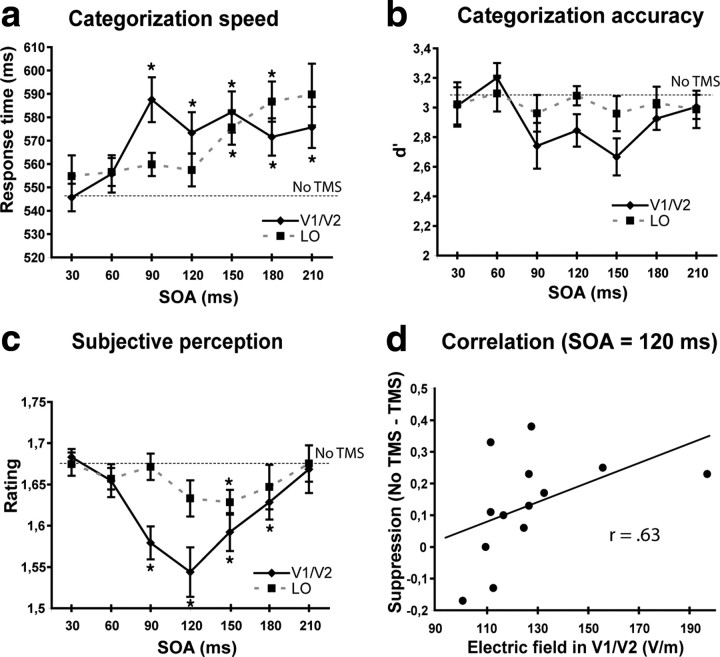
Figure 2.
a–c, The effects of stimulation of V1/V2 and LO on response times (a), accuracy (b), and subjective perception (c) at each image onset–TMS pulse asynchrony (SOA). The asterisks indicate the time points in which post hoc tests indicated that performance was impaired by TMS (p < 0.05). The onset of the critical activity period was earlier in V1/V2 than in LO, which was confirmed by significant differences between the areas at the SOA of 90 ms both in categorization speed and in subjective perception (p < 0.05). Error bars show SEM (Cousineau, 2007). d, Correlation between the TMS-induced E-field in the V1/V2 TMS target area and the TMS-induced suppression of subjective perception at the SOA of 120 ms in V1/V2 stimulation.

