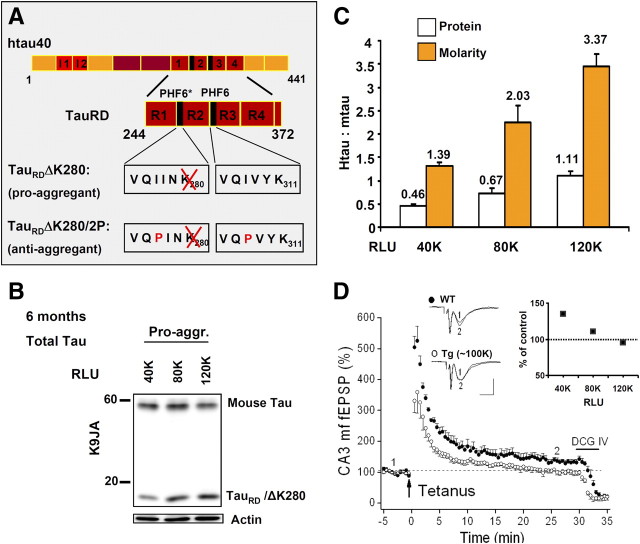
Figure 1.
Characterization of TauRD expression in mice. A, Bar diagrams illustrating the domains of full-length Tau (2N4R, 441 residues) and the repeat domain construct K18. Black segments indicate the hexapeptide motifs responsible for aggregation via β-structure. The pro-aggregant FTDP17 mutation ΔK280 and the anti-aggregant proline mutations (I277P, I308P) are highlighted. B, Expression level of TauRD/ΔK280 versus luciferase expression (RLU). Three mice with 40,000; 80,000; and 120,000 RLU are compared. The endogenous mouse Tau (Mr ∼ 55 kDa) is roughly comparable (top), as well as the actin control (bottom). The band of TauRD (Mr ∼ 14 kDa, middle) increases with the luciferase level. Tau bands are revealed by blotting with antibody K9JA. pro-aggr., Pro-aggregant. C, Quantitation of B (n = 4). White bars indicate that the protein ratio hTau:mTau deduced from blots varies almost linearly with luciferase readings. Orange bars show corresponding molar ratios calculated on the basis of molecular masses, ranging up to ∼3.4 at an RLU value of 120,000. D, Inverse relationship between loss of CA3–mossy fiber LTP and luciferase expression (RLU). This effect occurs only with pro-aggregant TauRD. The diagram depicts normalized mossy fiber fEPSPs before and after tetanic stimulation. In wild-type (WT) hippocampi, LTP attained 130 ± 4% (filled circles; n = 4), whereas transgenic hippocampi displaying 80,000–120,000 RLU failed to exhibit significant LTP (open circles; 105 ± 6%, n = 4). Representative fEPSP recordings from wild-type and transgenic hippocampi taken at the equivalent time points of the diagram are illustrated above. The inset depicts the inverse relationship between loss of LTP and RLU (40,000, n = 3; 80,000, n = 2; 120,000, n = 2). Note that the size of LTP at 40,000 RLU (138 ± 5%, n = 3) was not significantly different from the control.

