
Figure 2.
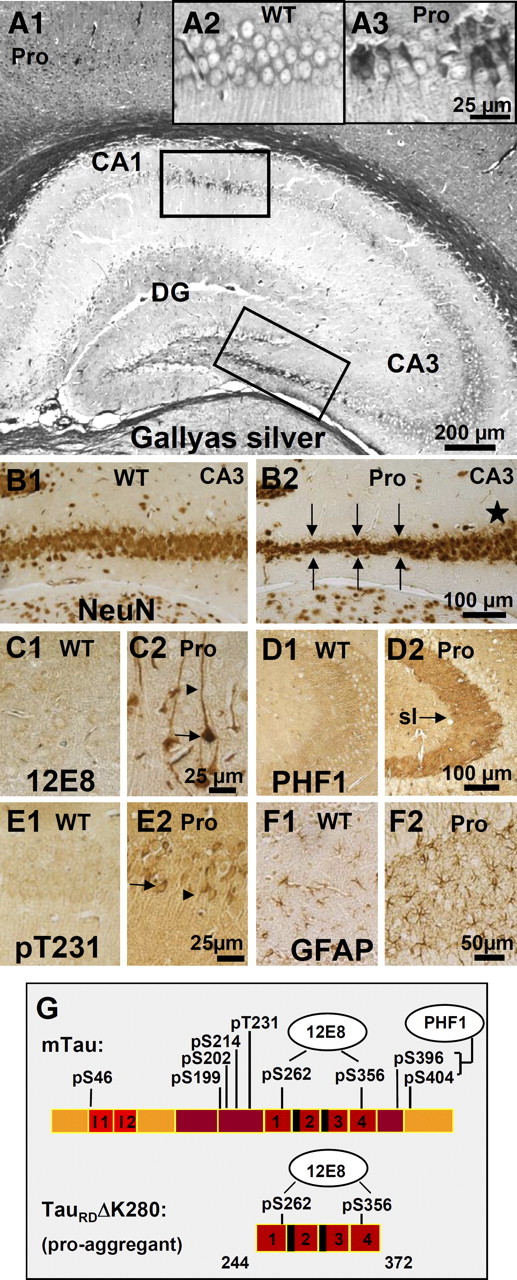
Histology of a pro-aggregant TauRD mouse at 10 months of expression. A, Gallyas silver staining of the hippocampus. Note prominent Tau aggregation in CA1, CA3, and DG regions of the pro-aggregant mutant mouse (A1). Insets show the boxed CA1 region with higher magnification for a Gallyas-negative wild-type (WT) animal (A2) compared with a pro-aggregant mutant mouse (A3). B, NeuN staining of neurons in the CA3 region (lower boxed area in A1) of a WT (B1) and a pro-aggregant mutant (B2) mouse. Note the loss of neurons in the pro-aggregant animal (B2, arrows) compared with the normal number of neurons in WT (B1) and the pro-aggregant mutant mouse within another part of the CA3 region (B2, star). C, Staining of somatosensoric cortical neurons by antibody 12E8 (against phosphorylated KXGS motifs inside the Tau repeat domain) for WT (C1) and pro-aggregant mutant (C2) mice. The phosphorylation (12E8 epitope) and missorting of Tau into the apical dendrites (arrowheads) and soma (arrows) appears only in the pro-aggregant mutant animal (C2). D, Pronounced PHF1 immunoreactivity (pS396, pS404) of the mossy fibers in the CA3 region of a pro-aggregant mutant mouse (D2, arrow; sl, stratum lucidum) compared with negatively stained mossy fibers of a WT mouse (D1). E, Stained CA1 neurons by an antibody against phosphorylated T231-Tau and the identification of missorted Tau into the soma (arrow) and apical dendrites (arrowhead) in the pro-aggregant mutant mouse (E2) compared with negative pyramidal neurons of the WT animal (E1). F, Staining by antibody against GFAP in the DG, revealing inflammatory processes by activated astrocytes for the pro-aggregant mutant mouse (F2) but not for the WT animal (F1). G, Bar diagram illustrating positions of phosphoepitopes inside and outside the Tau repeat domain. Staining with antibodies pS46, pS199, pS202, pS214, pT231, pS404, PHF1, and MC1 is positive, and staining with AT8 and AT270 is negative (data only partly shown) (see also Mocanu et al.,2008). Pro, Pro-aggregant mutant mouse; WT, Wild-type mouse. Scale bars: A1, 200 μm; B1, B2, D1, D2, 100 μm; F1, F2, 50 μm; A2, A3, C1, C2, E1, E2, 25 μm.